Metrics Plugin
Description
- Metrics plugin is used to monitor its own running status(JVM-related) by gateway, include request response delay, QPS, TPS, and other related metrics.
Technical Solutions
-
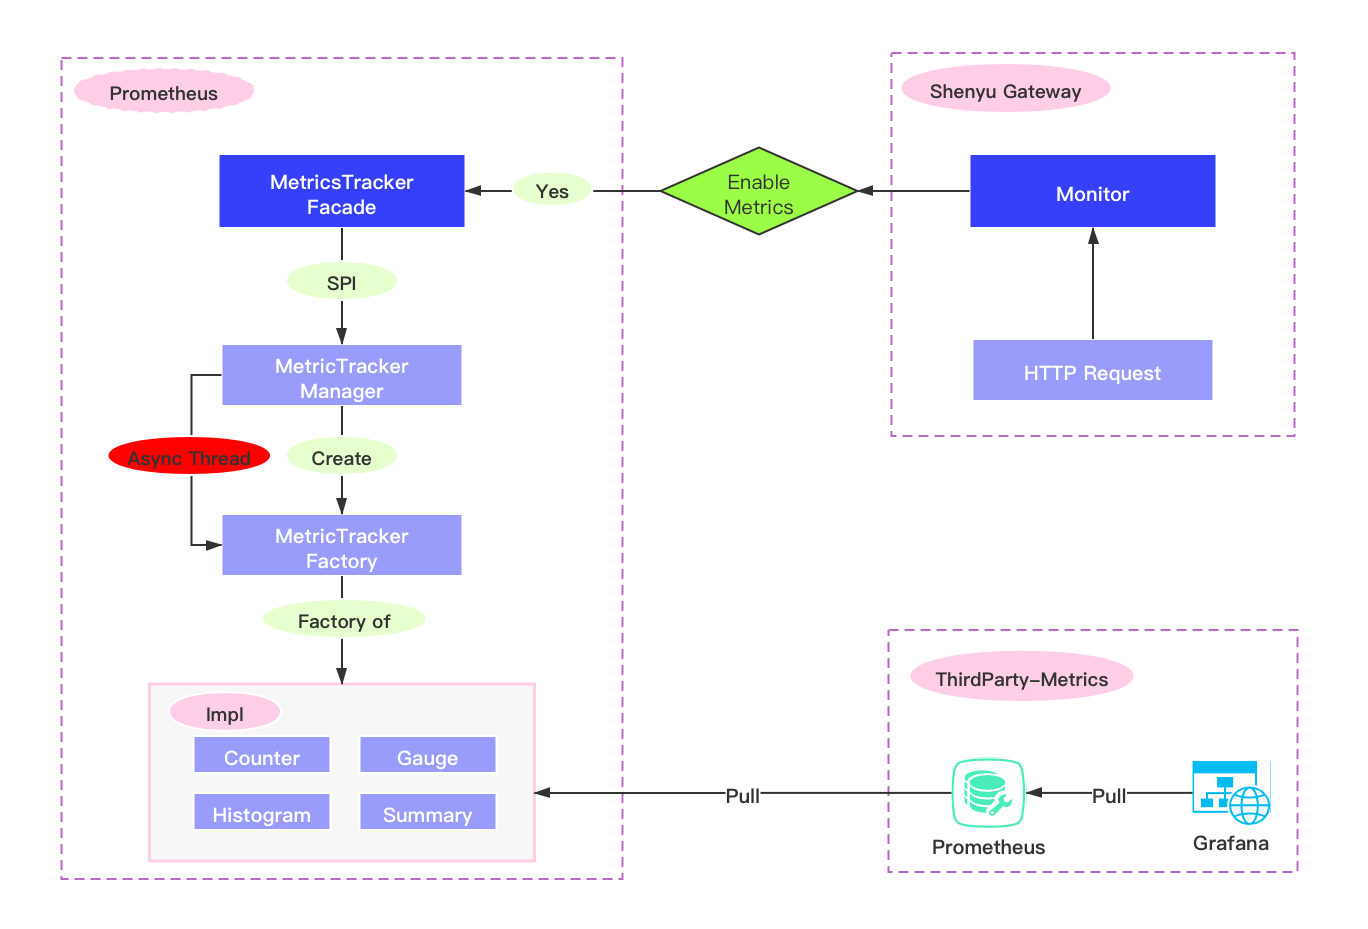
Flow Diagram
-
Make even tracking in ShenYu Gateway by asynchronous or synchronous mode.
-
The
prometheusserver pulls metrics' through http request, and then displays it byGrafana.
Plugin Setting
- Introduce
metricsdependency in the pom.xml file of the gateway.
  <!-- apache shenyu metrics plugin start-->
  <dependency>
      <groupId>org.apache.shenyu</groupId>
      <artifactId>shenyu-spring-boot-starter-plugin-metrics</artifactId>
      <version>${project.version}</version>
  </dependency>
  <!-- apache shenyu metrics plugin end-->
- modify this config in shenyu gateway yaml
shenyu:
  metrics:
    enabled: false #false is close, true is open
    name : prometheus
    host: 127.0.0.1
    port: 8090
    jmxConfig:
    props:
      jvm_enabled: true #enable jvm monitoring
Metrics Detail
-
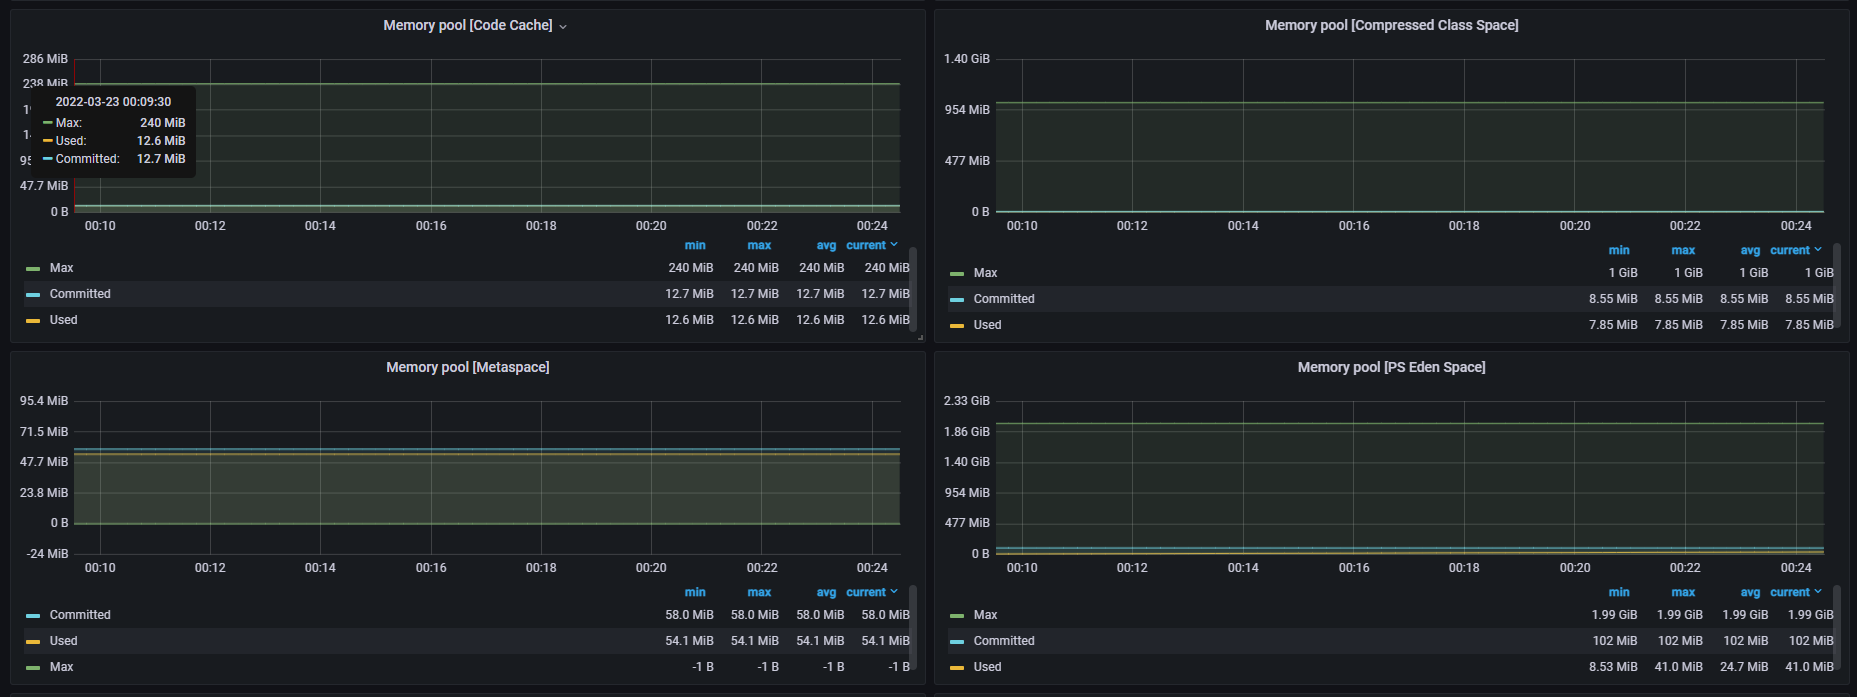
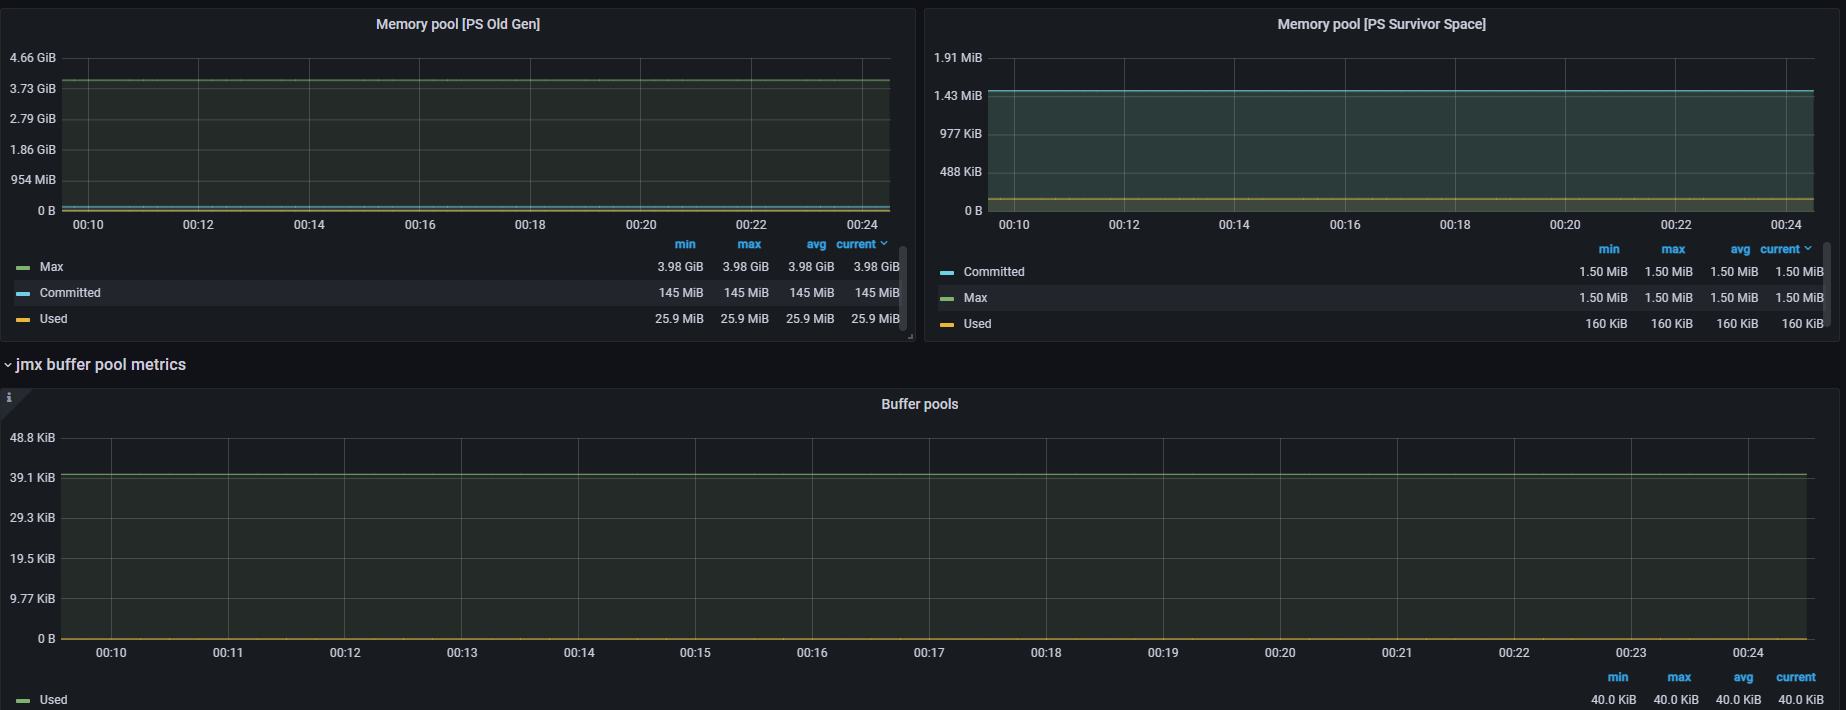
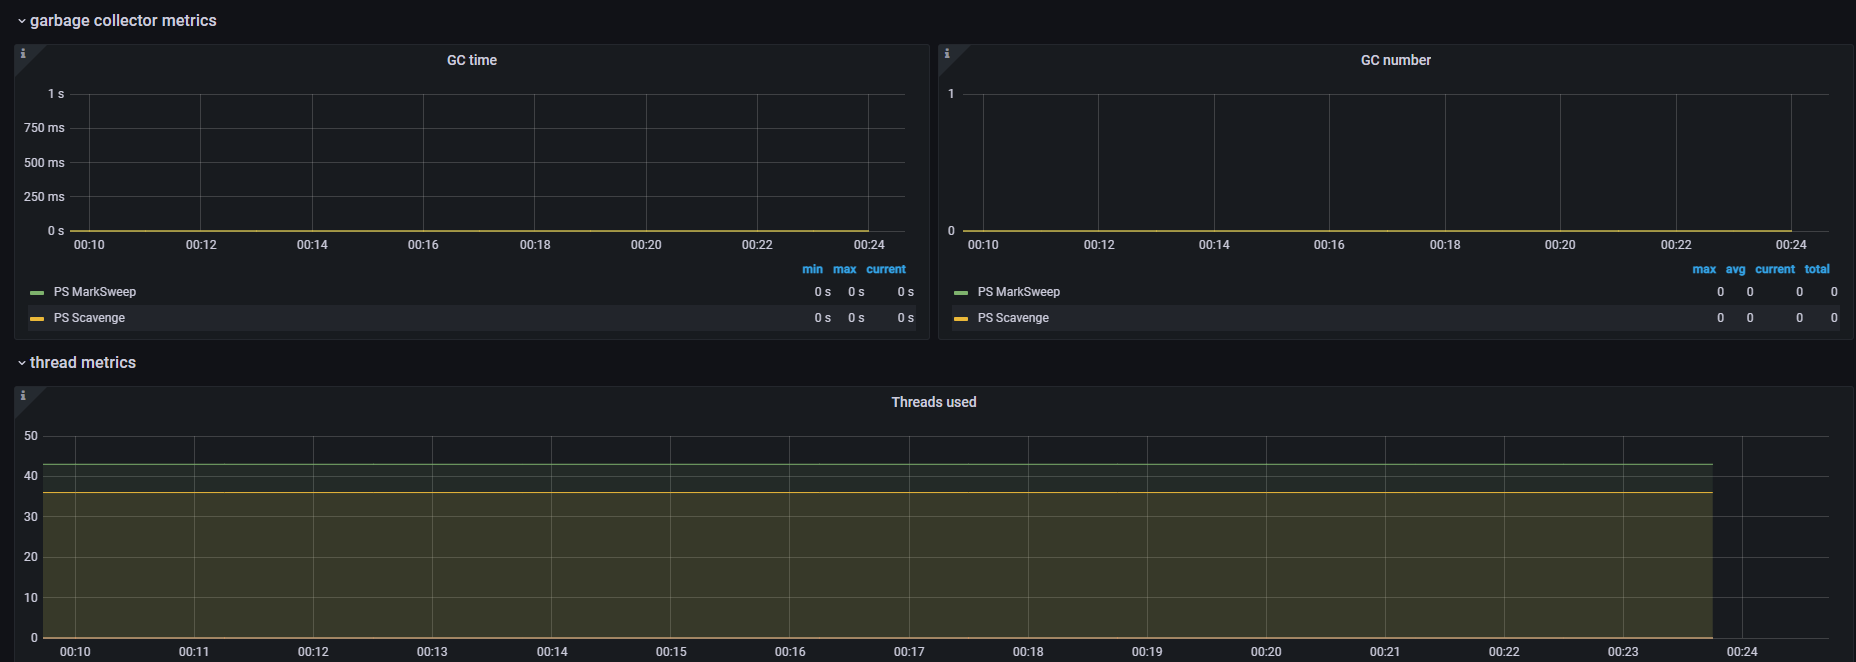
All JVM,thread,memory,and other related information will be made event tracking,you can add a JVM module in the Grafana' panel, and it will be fully displayed, please refer to: https://github.com/prometheus/jmx_exporter
-
There are also the following custom
metrics
shenyu gateway custom metrics
| Name | type | labels | description |
|---|---|---|---|
| shenyu_request_total | Counter | none | collecting all requests of Apache ShenYu Gateway |
| shenyu_request_throw_total | Counter | none | collecting all exception requests of Apache ShenYu Gateway |
| shenyu_request_type_total | Counter | path,type | collecting all matched requests of monitor |
| shenyu_execute_latency_millis | histogram | none | ShenYu gateway execute time interval |
jmx metrics
| name | type | labals | help |
|---|---|---|---|
| jmx_config_reload_success_total | counter | Number of times configuration have successfully been reloaded. | |
| jmx_config_reload_failure_total | counter | Number of times configuration have failed to be reloaded. | |
| jmx_scrape_duration_seconds | gauge | Time this JMX scrape took, in seconds. | |
| jmx_scrape_error | gauge | Non-zero if this scrape failed. | |
| jmx_scrape_cached_beans | gauge | Number of beans with their matching rule cached | |
| jmx_scrape_duration_seconds | gauge | Time this JMX scrape took, in seconds. | |
| jmx_scrape_error | gauge | Non-zero if this scrape failed. | |
| jmx_scrape_cached_beans | gauge | Number of beans with their matching rule cached |
jvm metrics
StandardExports
| name | type | labels | help |
|---|---|---|---|
| process_cpu_seconds_total | counter | Total user and system CPU time spent in seconds. | |
| process_start_time_seconds | gauge | Start time of the process since unix epoch in seconds. | |
| process_open_fds | gauge | Number of open file descriptors. | |
| process_max_fds | gauge | Maximum number of open file descriptors. | |
| process_virtual_memory_bytes | gauge | Virtual memory size in bytes. | |
| process_resident_memory_bytes | gauge | Resident memory size in bytes. |
MemoryPoolsExports
| name | type | labels | help |
|---|---|---|---|
| jvm_memory_objects_pending_finalization | gauge | {area="heap|nonheap"} | The number of objects waiting in the finalizer queue. |
| jvm_memory_bytes_used | gauge | {area="heap|nonheap"} | Used bytes of a given JVM memory area. |
| jvm_memory_bytes_committed | gauge | {area="heap|nonheap"} | Committed (bytes) of a given JVM memory area. |
| jvm_memory_bytes_max | gauge | {area="heap|nonheap"} | Max (bytes) of a given JVM memory area. |
| jvm_memory_bytes_init | gauge | {area="heap|nonheap"} | Initial bytes of a given JVM memory area. |
| jvm_memory_pool_bytes_used | gauge | {pool} | Used bytes of a given JVM memory pool. |
| jvm_memory_pool_bytes_committed | gauge | {pool} | Committed bytes of a given JVM memory pool. |
| jvm_memory_pool_bytes_max | gauge | {pool} | Max bytes of a given JVM memory pool. |
| jvm_memory_pool_bytes_init | gauge | {pool} | Initial bytes of a given JVM memory pool. |
| jvm_memory_pool_collection_used_bytes | gauge | {pool} | Used bytes after last collection of a given JVM memory pool. |
| jvm_memory_pool_collection_committed_bytes | gauge | {pool} | Committed after last collection bytes of a given JVM memory pool. |
| jvm_memory_pool_collection_max_bytes | gauge | {pool} | Max bytes after last collection of a given JVM memory pool. |
| jvm_memory_pool_collection_init_bytes | gauge | {pool} | Initial after last collection bytes of a given JVM memory pool. |
MemoryAllocationExports
| name | type | labels | help |
|---|---|---|---|
| jvm_memory_pool_allocated_bytes_total | counter | {pool} | Total bytes allocated in a given JVM memory pool. Only updated after GC, not continuously. |
BufferPoolsExports
| name | type | labels | help |
|---|---|---|---|
| jvm_buffer_pool_used_bytes | gauge | {pool} | Used bytes of a given JVM buffer pool. |
| jvm_buffer_pool_capacity_bytes | gauge | {pool} | Bytes capacity of a given JVM buffer pool. |
| jvm_buffer_pool_used_buffers | gauge | {pool} | Used buffers of a given JVM buffer pool. |
GarbageCollectorExports
| name | type | labels | help |
|---|---|---|---|
| jvm_gc_collection_seconds | summary | {gc} | Time spent in a given JVM garbage collector in seconds. |
ThreadExports
| name | type | labels | help |
|---|---|---|---|
| jvm_threads_current | gauge | Current thread count of a JVM | |
| jvm_threads_daemon | gauge | Daemon thread count of a JVM | |
| jvm_threads_peak | gauge | Peak thread count of a JVM | |
| jvm_threads_started_total | counter | Started thread count of a JVM | |
| jvm_threads_deadlocked | gauge | Cycles of JVM-threads that are in deadlock waiting to acquire object monitors or ownable synchronizers | |
| jvm_threads_deadlocked_monitor | gauge | Cycles of JVM-threads that are in deadlock waiting to acquire object monitors | |
| jvm_threads_state | gauge | {state} | Current count of threads by state |
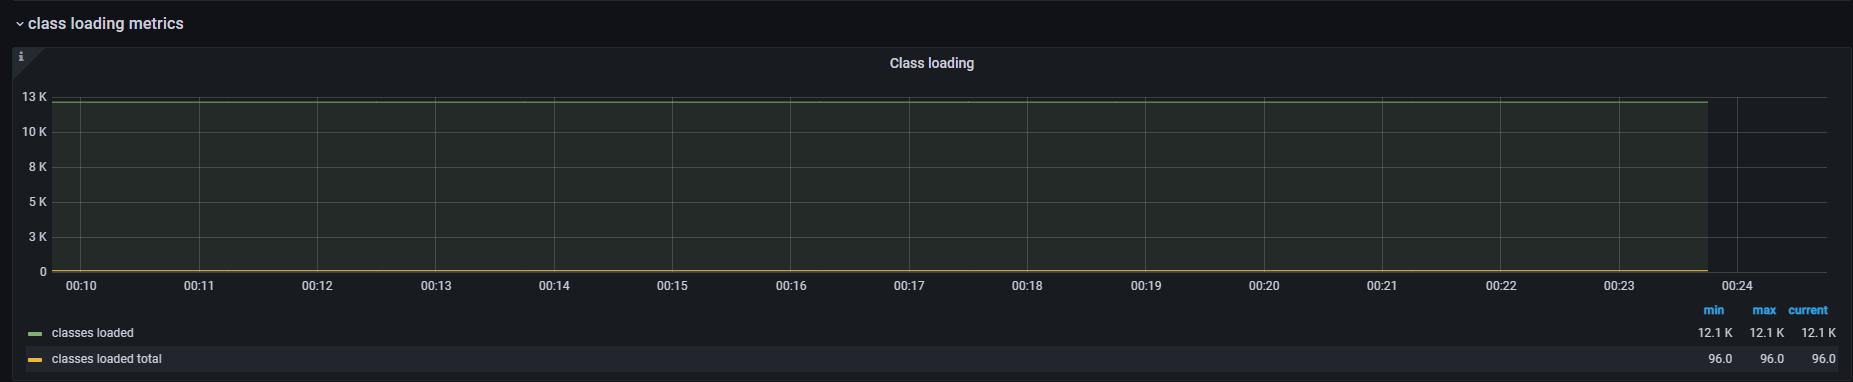
ClassLoadingExports
| name | type | labels | help |
|---|---|---|---|
| jvm_classes_loaded | gauge | The number of classes that are currently loaded in the JVM | |
| jvm_classes_loaded_total | counter | The total number of classes that have been loaded since the JVM has started execution | |
| jvm_classes_unloaded_total | counter | The total number of classes that have been unloaded since the JVM has started execution |
VersionInfoExports
| name | type | labels | help |
|---|---|---|---|
| jvm | info | {version(java.runtime.version),vendor(java.vm.vendor),runtime(java.runtime.name)} | VM version info |
Collect metrics
Users need to install Prometheus service to collect
Install Prometheus in windows
- Choose the corresponding environment download address to install
- Modify configuration file:
prometheus.yml
scrape_configs:
  - job_name: 'Apache ShenYu'
    # metrics_path defaults to '/metrics'
    # scheme defaults to 'http'.
    static_configs:
    - targets: ['localhost:8090'] # metrics of apache shenyu are exposed on port 8090 by default
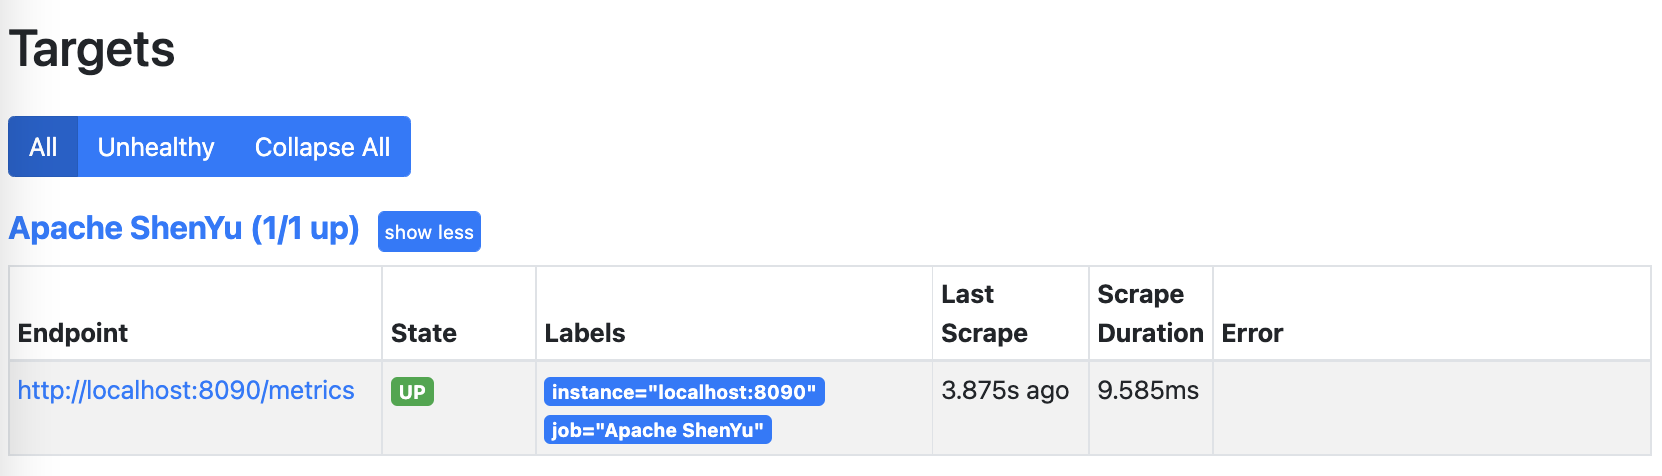
- After the configuration is completed, you can directly double-click
prometheus.exein the window to start. The default boot port is9090,checkstatus->Targets. Success can be verified at http://localhost:9090/
Install Prometheus in the macOS
- Install prometheus with brew,After installation
prometheusis in theCellarfolder underhomebrew。
brew install prometheus
- Execute the following command in the location of the prometheus.yml file to start prometheus。
prometheus --config.file=prometheus.yml &
Visit http://localhost:9090/ to verify that it starts normally。
Panel Display
It is recommended to use Grafana, Users can customize the query to personalize the display panel.
Here's how to install and deploy Grafana
Install Grafana in windows
- Install Grafana
download Unzip it and enter the bin directory and double-click grafana-server.exe to run it. Go to http://localhost:3000/?orgId=1 admin/admin to verify the success
Install Grafana in macOS
- Install grafana using brew.
brew install grafana
- Start grafana as a service
brew services start grafana
Visit http://localhost:3000/ to verify that it starts normally.
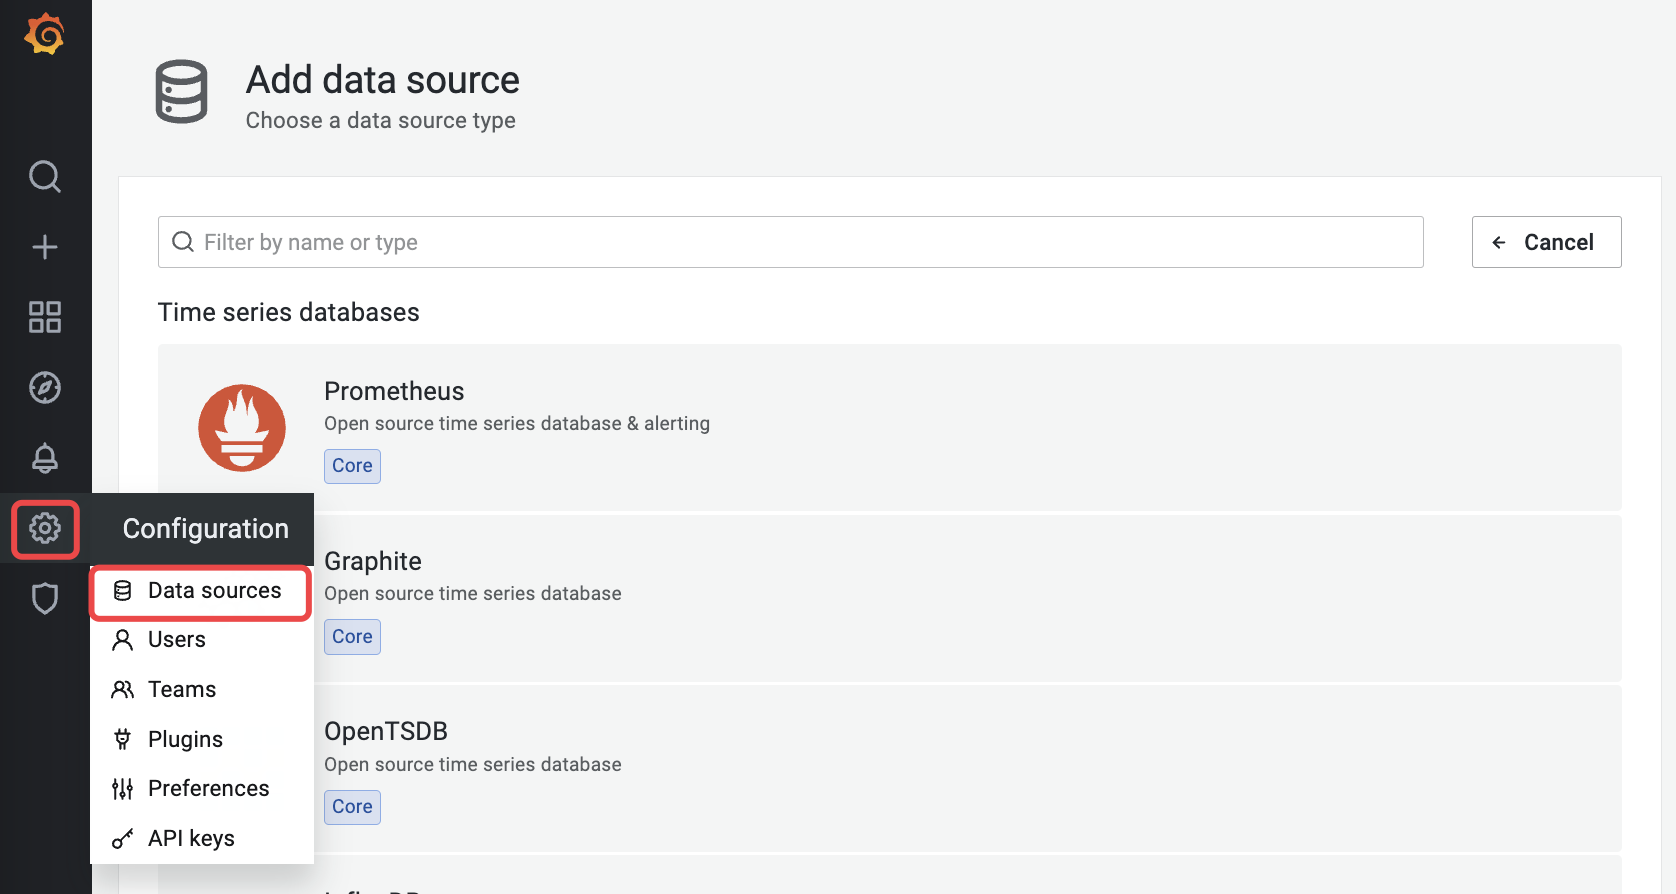
View monitoring data with Grafana
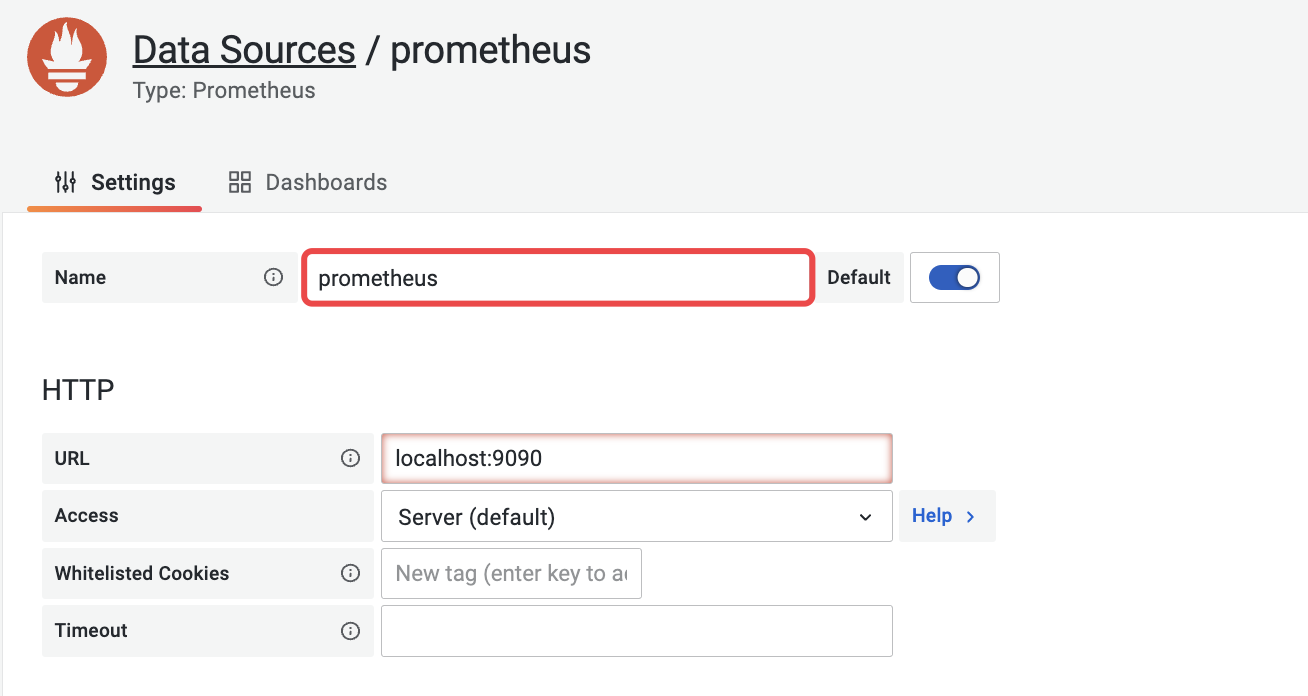
- Configure the data source, select prometheus, note that the data source name is prometheus.
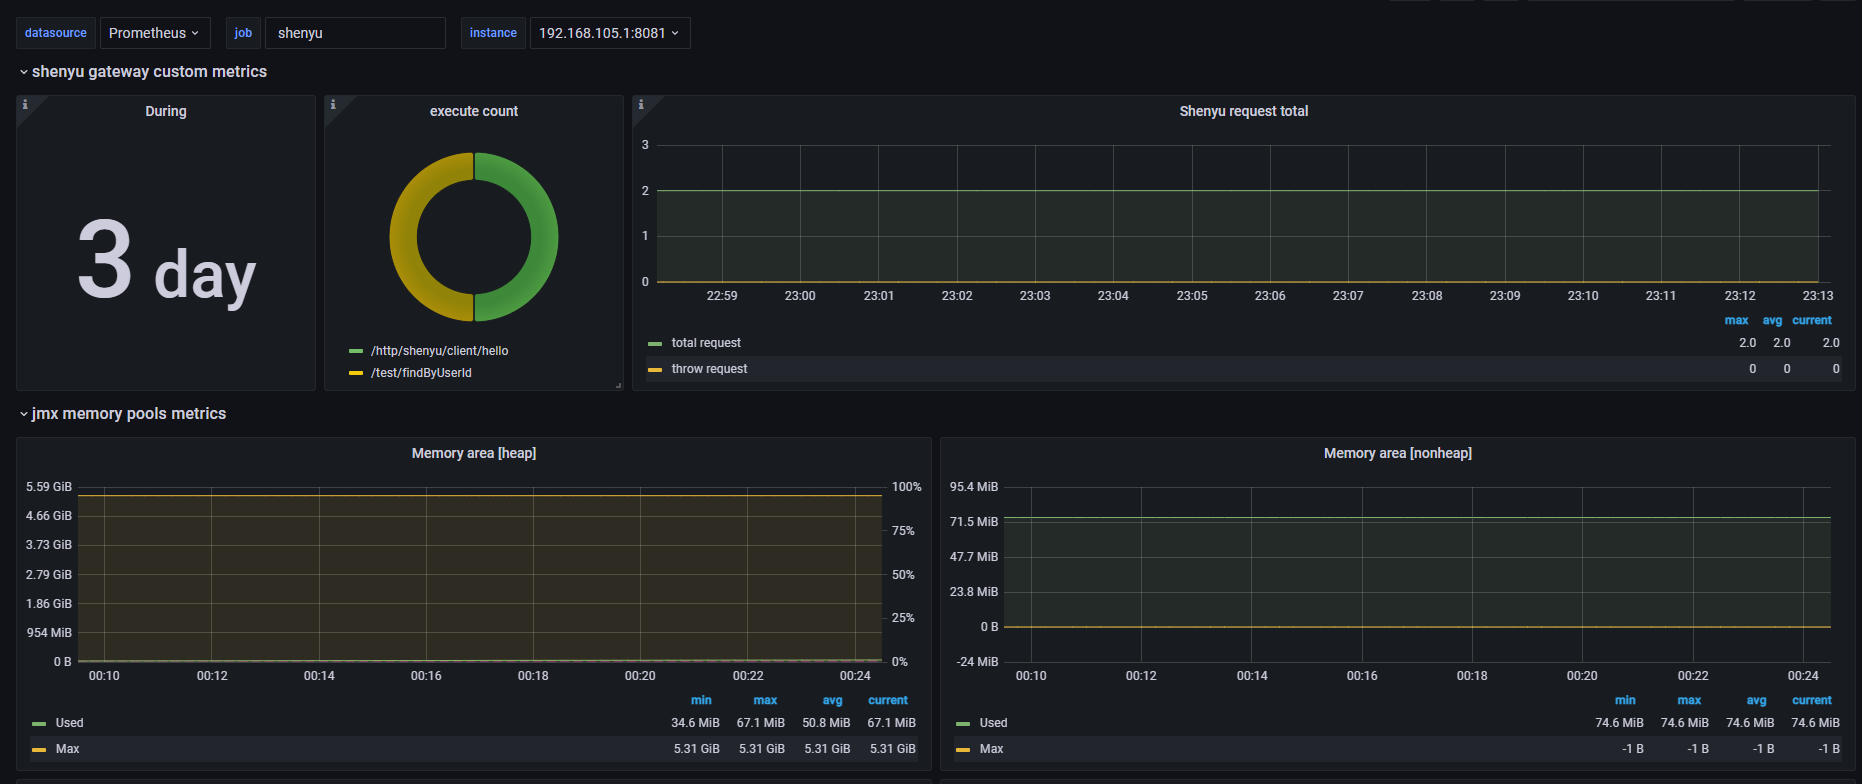
- Config Custom Metric Dashboard
request_total、http_request_total
Click Create - Import and enter the panel config json
The final custom HTTP request monitoring panel looks like this: