Metrics插件
说明
Metrics插件插件是网关用来监控自身运行状态(JVM相关),请求的响应迟延,QPS、TPS等相关metrics。
技术方案
-
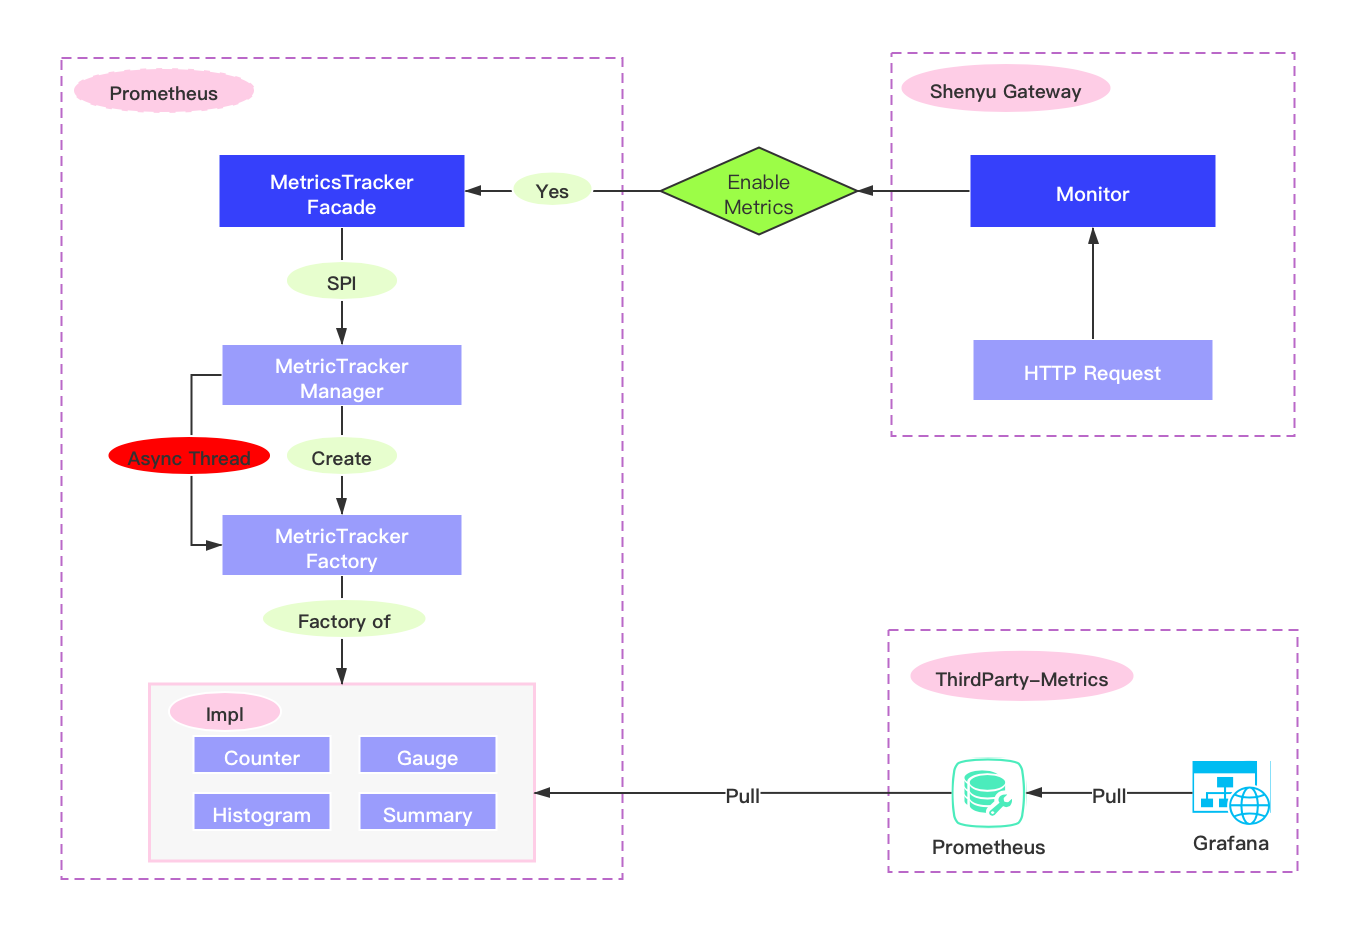
流程图
-
异步或者同步的方式,在
Apache ShenYu网关里面进行metrics埋点。 -
prometheus服务端通过http请求来拉取metrics,再使用Grafana展示。
插件使用
- 在网关的
pom.xml文件中添加metrics的依赖。
        <!-- apache shenyu metrics plugin starter-->
        <dependency>
            <groupId>org.apache.shenyu</groupId>
            <artifactId>shenyu-spring-boot-starter-plugin-metrics</artifactId>
            <version>${project.version}</version>
        </dependency>
        <!-- apache shenyu metrics plugin end-->
- 在网关的配置yaml文件中编辑如下内容:
shenyu:
  metrics:
    enabled: false  #设置为 true 表示开启
    name : prometheus
    host: 127.0.0.1 #暴露的ip
    port: 8090 #暴露的端口
    jmxConfig: #jmx配置
    props:
      jvm_enabled: true #开启jvm的监控指标
metrics信息
-
所有的
JVM,线程,内存,等相关信息都会埋点,可以在Grafana面板中,新增一个JVM模块,则会完全展示 具体请看:https://github.com/prometheus/jmx_exporter -
另外还��有如下自定义的
metrics
| 名称 | 类型 | 标签名称 | 说明 |
|---|---|---|---|
| shenyu_request_total | Counter | none | 收集ShenYu网关的所有请求 |
| shenyu_request_throw_total | Counter | none | 收集ShenYu网关的所有异常请求 |
| shenyu_request_type_total | Counter | path,type | 收集ShenYu网关监视器的所有匹配请求 |
| shenyu_execute_latency_millis | histogram | none | 收集ShenYu网关执行时间间隔 |
jmx 指标
| name | type | labals | help |
|---|---|---|---|
| jmx_config_reload_success_total | counter | 成功重新加载配置的次数. | |
| jmx_config_reload_failure_total | counter | 重新加载配置失败的次数. | |
| jmx_scrape_duration_seconds | gauge | 此 JMX 抓取所用的秒数. | |
| jmx_scrape_error | gauge | 如果此抓取失败,则非零. | |
| jmx_scrape_cached_beans | gauge | 有缓存匹配规则的bean的数量 | |
| jmx_scrape_duration_seconds | gauge | 此 JMX 抓取所花费的秒数. |
jvm 指标
StandardExports
| name | type | labels | help |
|---|---|---|---|
| process_cpu_seconds_total | counter | 用户和系统CPU总计所用的秒数. | |
| process_start_time_seconds | gauge | 自 unix 元年(1970-01-01)以来进程的开始时间. | |
| process_open_fds | gauge | 打开的文件描述符的数量. | |
| process_max_fds | gauge | 打开的文件描述符的最大数量. | |
| process_virtual_memory_bytes | gauge | 虚拟内存的字节数. | |
| process_resident_memory_bytes | gauge | 常驻内存的字节数. |
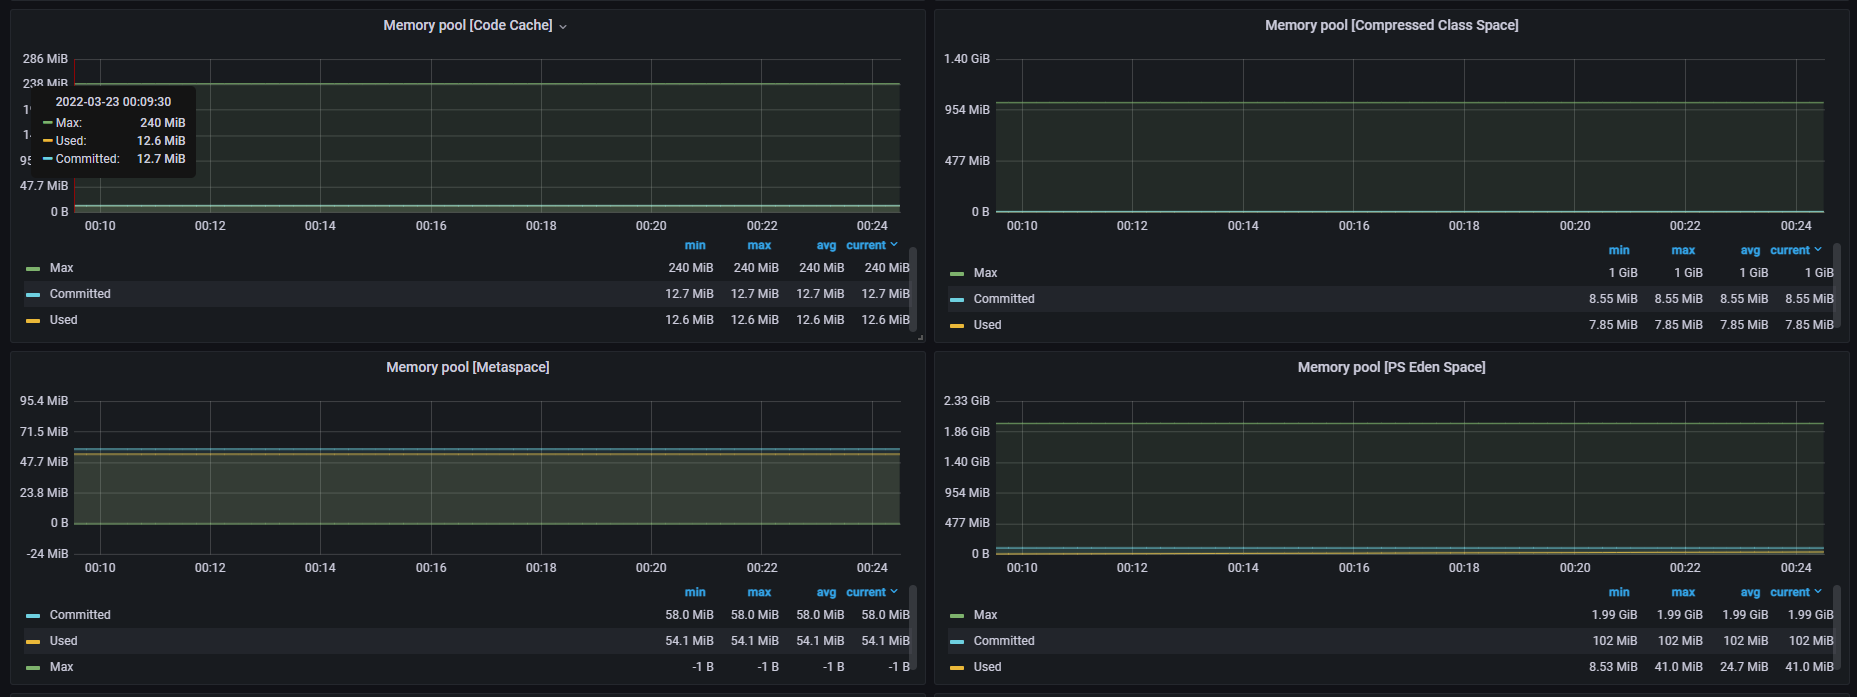
MemoryPoolsExports
| name | type | labels | help |
|---|---|---|---|
| jvm_memory_objects_pending_finalization | gauge | {area="heap|nonheap"} | 在终结器队列中等待的对象数. |
| jvm_memory_bytes_used | gauge | {area="heap|nonheap"} | 给定 JVM 内存区域的已用字节数. |
| jvm_memory_bytes_committed | gauge | {area="heap|nonheap"} | 给定 JVM 内存区域的已提交字节数. |
| jvm_memory_bytes_max | gauge | {area="heap|nonheap"} | 给定 JVM 内存区域的最大字节数. |
| jvm_memory_bytes_init | gauge | {area="heap|nonheap"} | 给定 JVM 内存区域的初始字节数. |
| jvm_memory_pool_bytes_used | gauge | {pool} | 给定 JVM 内存池的已用字节数. |
| jvm_memory_pool_bytes_committed | gauge | {pool} | 给定 JVM 内存池的已提交字节数. |
| jvm_memory_pool_bytes_max | gauge | {pool} | 给定 JVM 内存池的最大字节数. |
| jvm_memory_pool_bytes_init | gauge | {pool} | 给定 JVM 内存池的初始字节数. |
| jvm_memory_pool_collection_used_bytes | gauge | {pool} | 给定 JVM 内存池最后一次 GC 后的已用字节数. |
| jvm_memory_pool_collection_committed_bytes | gauge | {pool} | 给定 JVM 内存池的最后一次 GC 后的已提交字节数. |
| jvm_memory_pool_collection_max_bytes | gauge | {pool} | 给定 JVM 内存池的最后一次 GC 后的最大字节数. |
| jvm_memory_pool_collection_init_bytes | gauge | {pool} | 给定 JVM 内存池的最后一次 GC 后的初始字节数. |
MemoryAllocationExports
| name | type | labels | help |
|---|---|---|---|
| jvm_memory_pool_allocated_bytes_total | counter | {pool} | 给定 JVM 内存池中分配的总字节数.(只有 GC 的时候才会更新) |
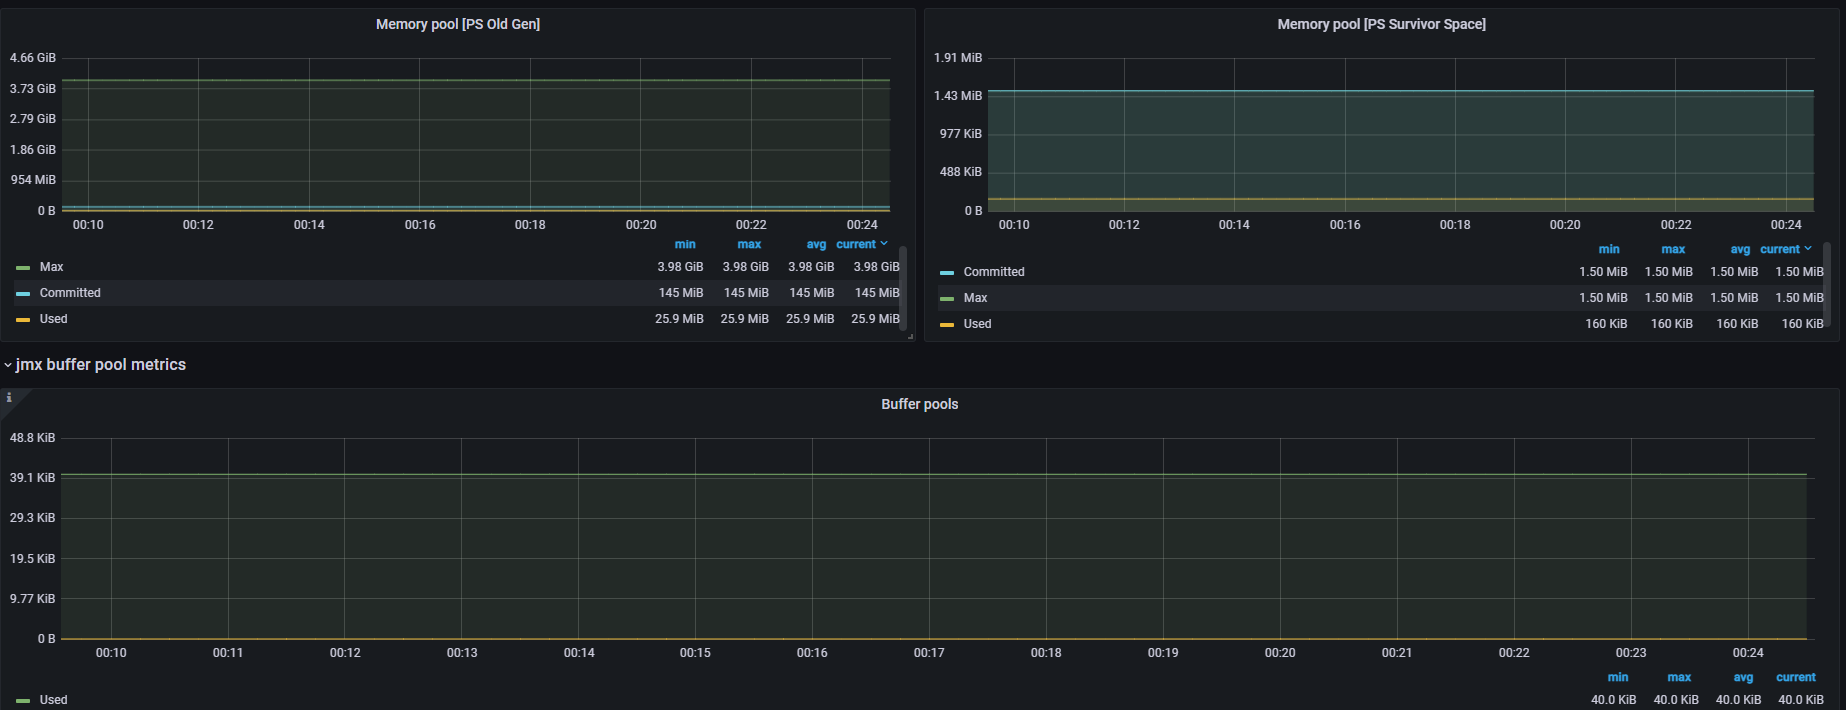
BufferPoolsExports
| name | type | labels | help |
|---|---|---|---|
| jvm_buffer_pool_used_bytes | gauge | {pool} | 给定 JVM 缓冲池的已用字节数. |
| jvm_buffer_pool_capacity_bytes | gauge | {pool} | 给定 JVM 缓冲池的字节容量. |
| jvm_buffer_pool_used_buffers | gauge | {pool} | 给定 JVM 缓冲池的已用缓冲区. |
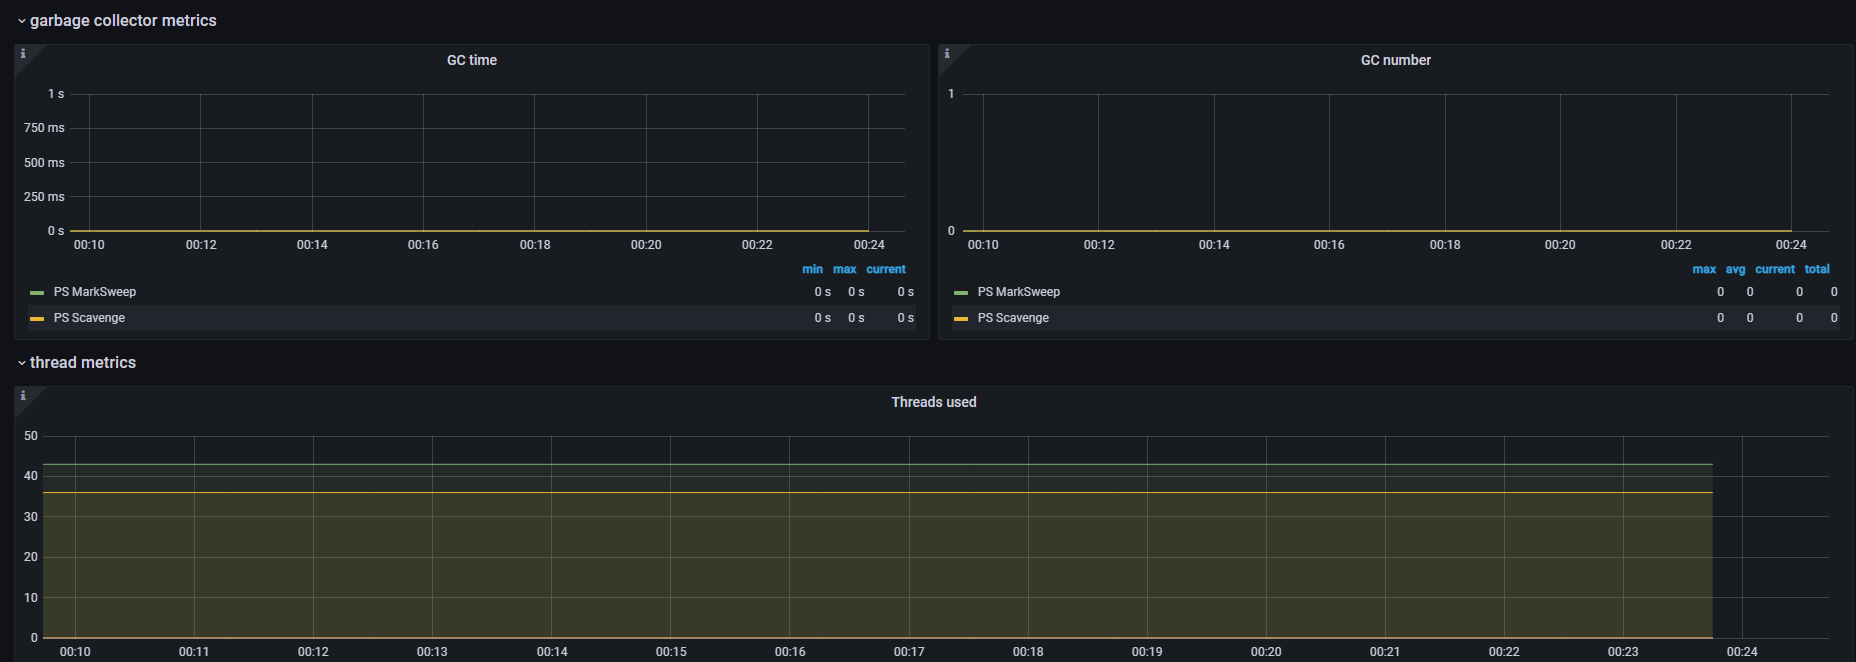
GarbageCollectorExports
| name | type | labels | help |
|---|---|---|---|
| jvm_gc_collection_seconds | summary | {gc} | 在给定的 JVM 垃圾收集器中花费的秒数. |
ThreadExports
| name | type | labels | help |
|---|---|---|---|
| jvm_threads_current | gauge | JVM 的当前线程数 | |
| jvm_threads_daemon | gauge | JVM 的守护进程线程数 | |
| jvm_threads_peak | gauge | JVM 的峰值线程�数 | |
| jvm_threads_started_total | counter | JVM 的已启动的线程数 | |
| jvm_threads_deadlocked | gauge | 处于死锁状态的 JVM 线程循环等待获取对象监视器或可拥有的同步器 | |
| jvm_threads_deadlocked_monitor | gauge | 处于死锁等待获取对象监视器的 JVM 线程周期 | |
| jvm_threads_state | gauge | {state} | 状态为{state}的线程数 |
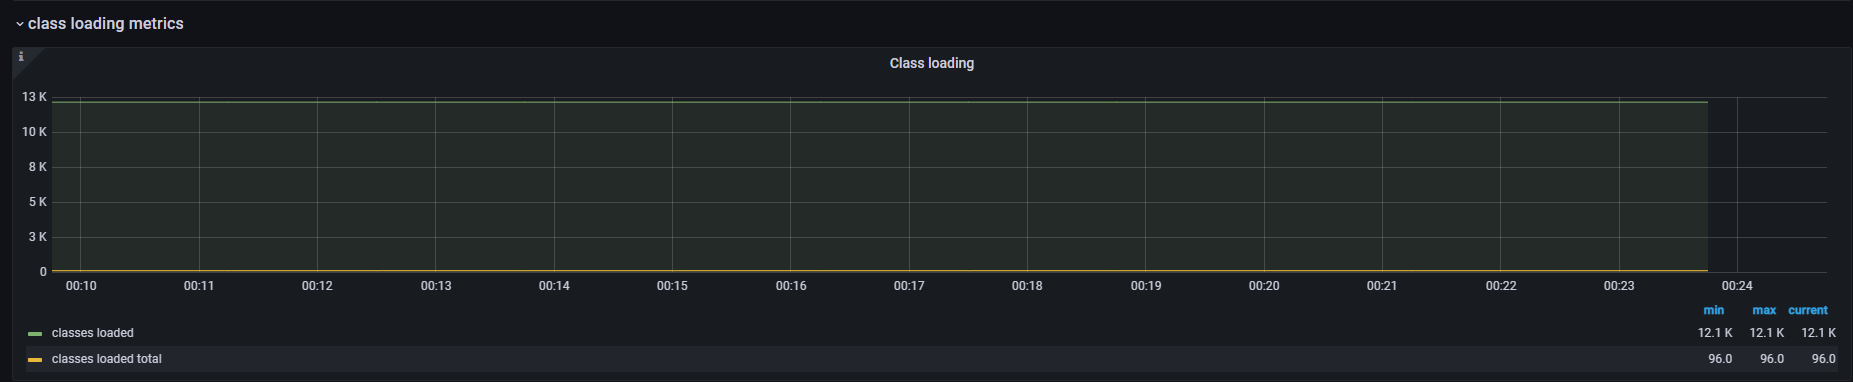
ClassLoadingExports
| name | type | labels | help |
|---|---|---|---|
| jvm_classes_loaded | gauge | 当前在 JVM 中加载的类的数量 | |
| jvm_classes_loaded_total | counter | 自 JVM 开始执行以来已加载的类总数 | |
| jvm_classes_unloaded_total | counter | 自 JVM 开始执行以来已卸载的类总数 |
VersionInfoExports
| name | type | labels | help |
|---|---|---|---|
| jvm | info | {version(java.runtime.version),vendor(java.vm.vendor),runtime(java.runtime.name)} | JVM 版本信息 |
收集 metrics
用户需部署Prometheus 服务来采集
Windows 环境下安装Prometheus
- 选择对应环境的 下载地址 安装
- 修改配置文件:
prometheus.yml
scrape_configs:
  - job_name: 'Apache ShenYu'
    # metrics_path defaults to '/metrics'
    # scheme defaults to 'http'.
    static_configs:
    - targets: ['localhost:8090'] # metrics of apache shenyu are exposed on port 8090 by default
注: job_name�跟monitor插件配置的metricsName相对应
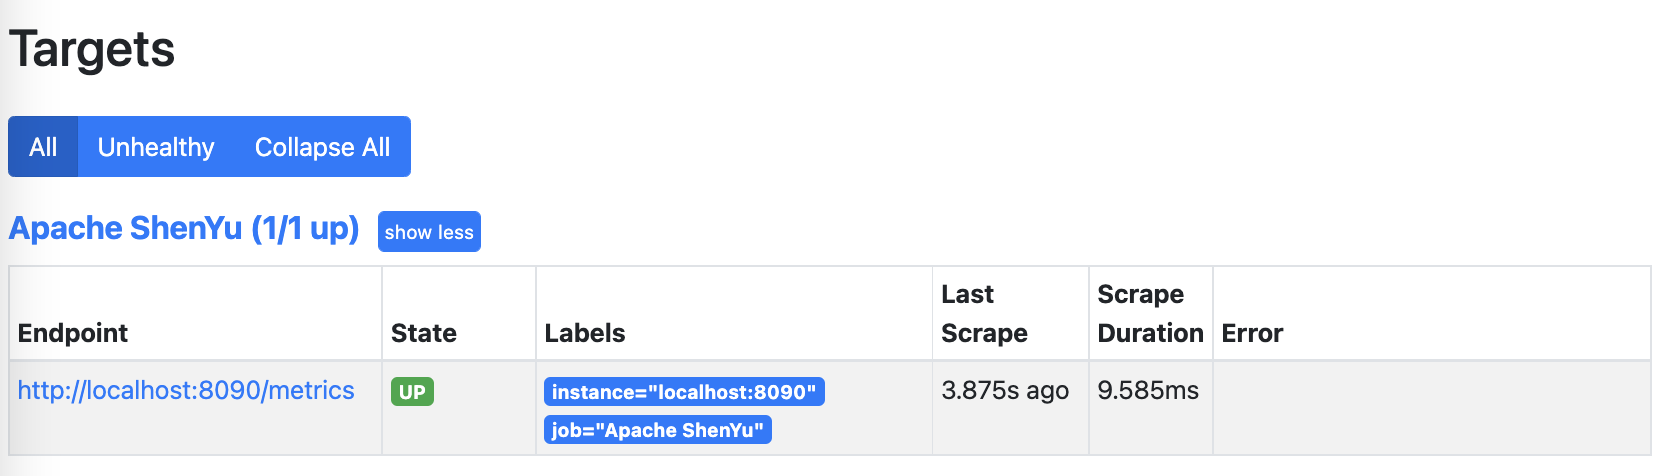
- 配置完成之后,在
windows下可以直接双击prometheus.exe启动即可,默认启动端口为9090,访问 http://localhost:9090/ ,点击status->Targets,验证是否成功。
MacOS 环境下安装Prometheus
- 使用brew 安装 prometheus,安装完成后
prometheus在homebrew下的Cellar文件夹中。
brew install prometheus
- 在prometheus.yml文件所在位置执行如下命令即可启动prometheus。
prometheus --config.file=prometheus.yml &
访问 http://localhost:9090/ 验证是否正常启动。
面板展示
推荐使用 Grafana,用户可以自定义查询来个性化显示面板盘。
下面介绍如何安装 Grafana
windows环境下安装Grafana
- 安装
Grafana
下载地址 解压进入 bin 目录然后双击 grafana-server.exe 运行 访问 http://localhost:3000/?orgId=1 admin/admin 验证是否成功
macos环境下安装Grafana
- 使用brew 安装 grafana 。
brew install grafana
- 以服务方式启动grafana
brew services start grafana
访问 http://localhost:3000/ 验证是否正常启动。
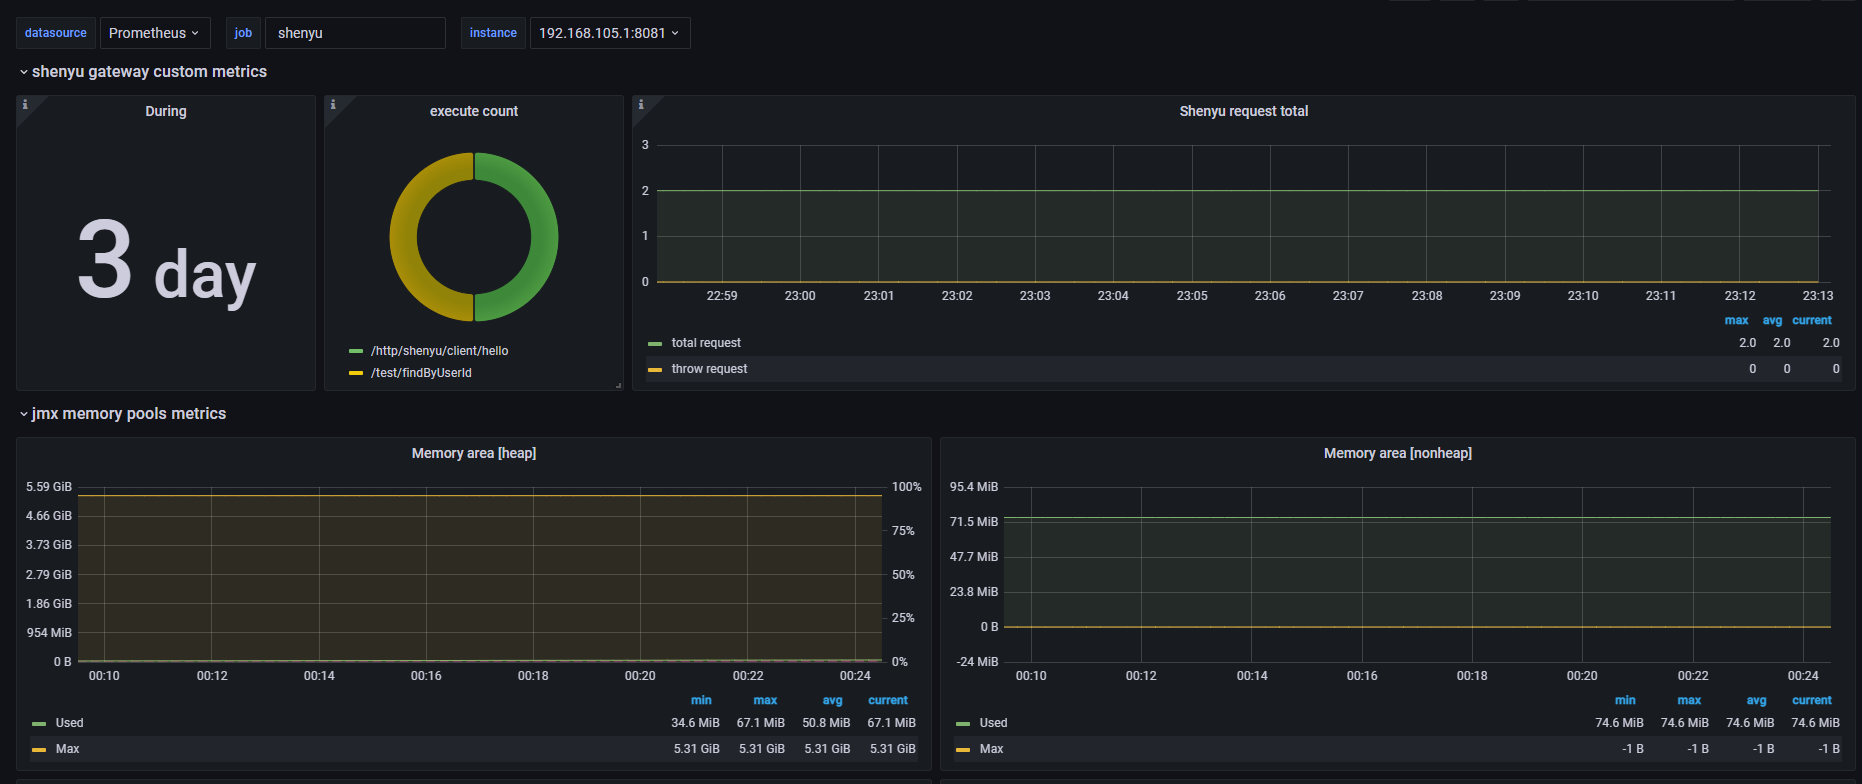
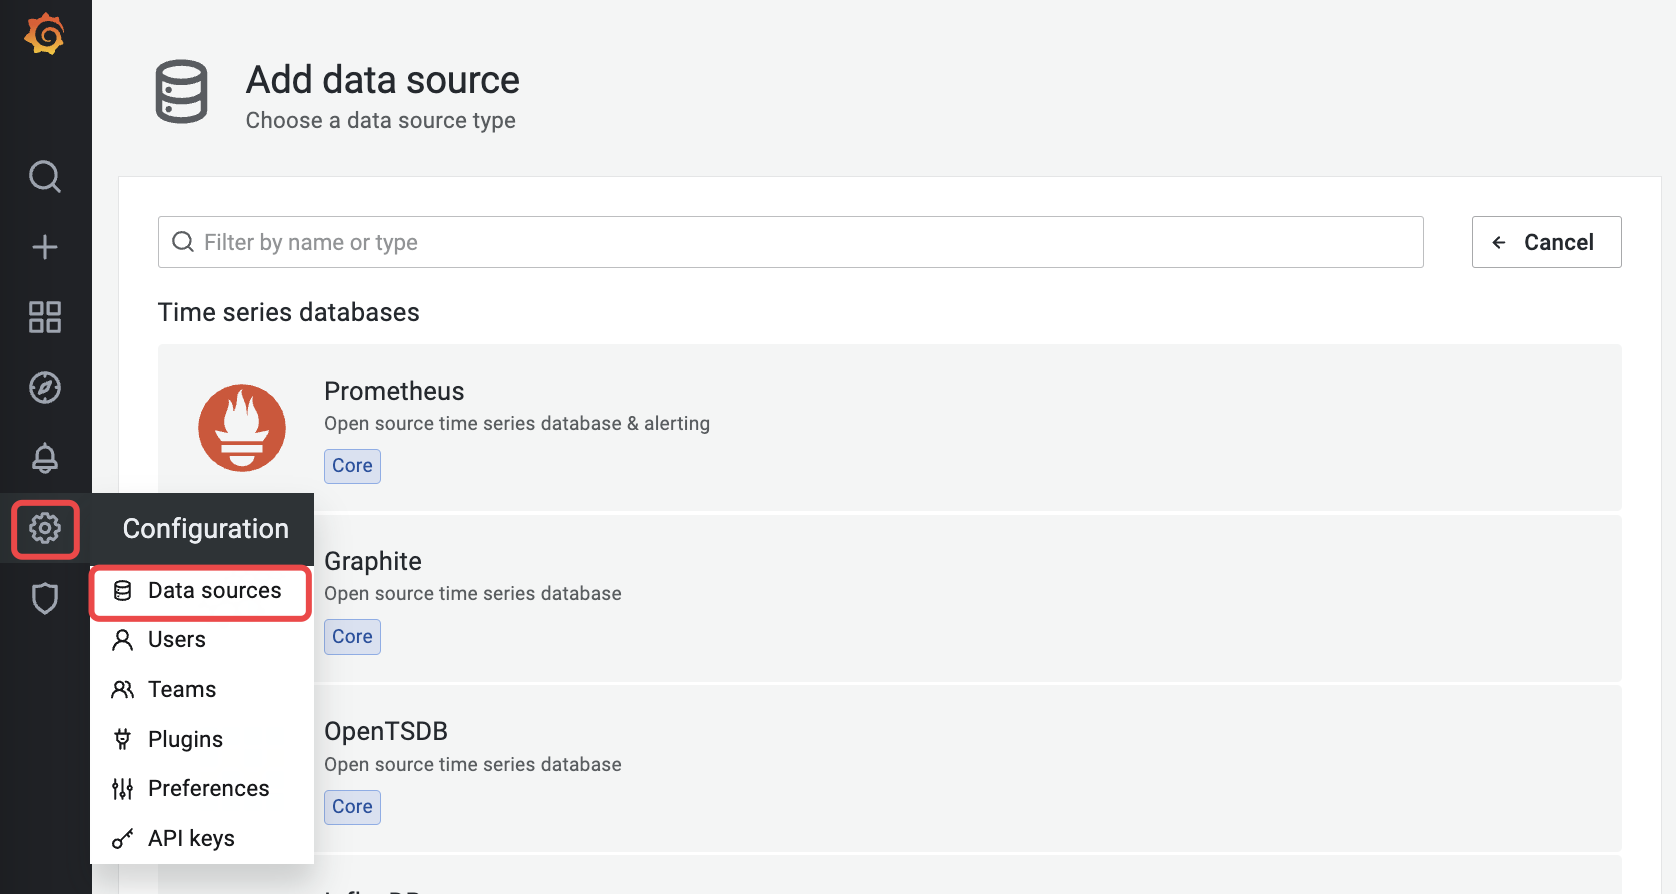
使用Grafana查看监控数据
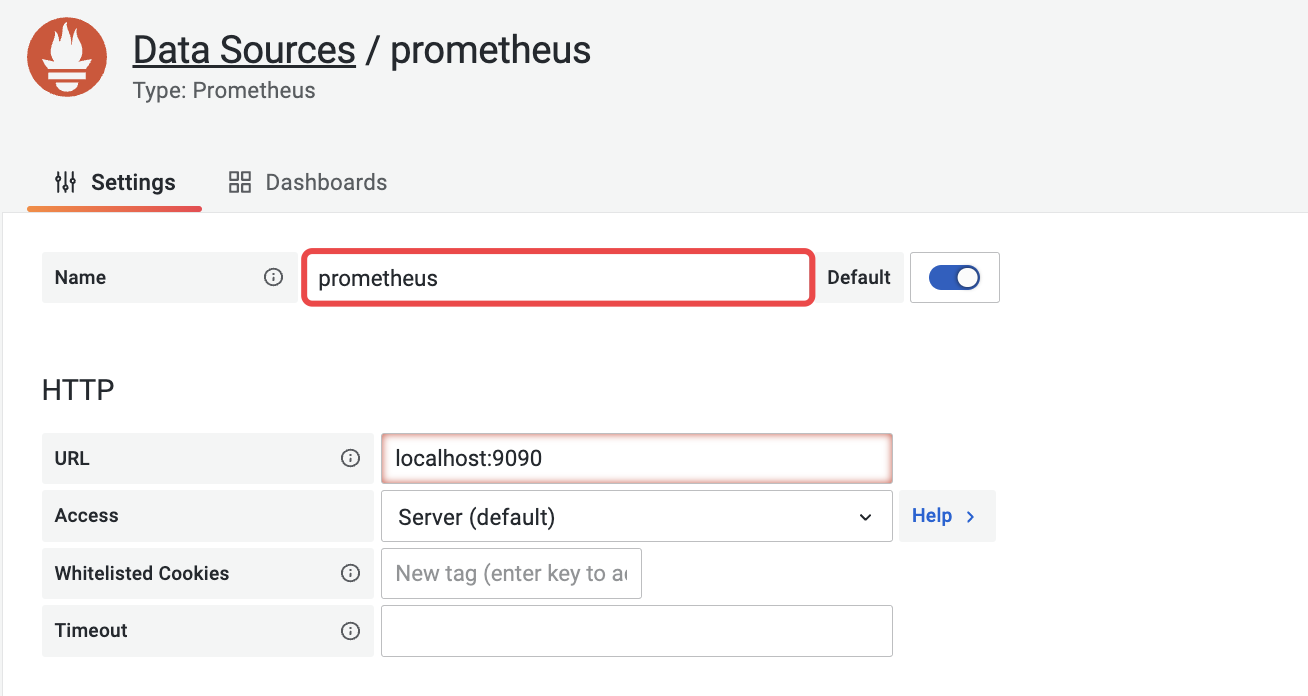
配置数据源,选择prometheus,注意数据源名字为prometheus。
- 配置自定义metric面板
request_total、http_request_total
点击 Create - Import 输入dashboards 的 面板json配置
最终自定义 Http 请求监控面板效果如下: