1. Overview
1.1 Plugin Name
- Logging-ElasticSearch Plugin
1.2 Appropriate Scenario
- collect http request info to elasticsearch, query or display request info by another application(kibana).
1.3 Plugin functionality
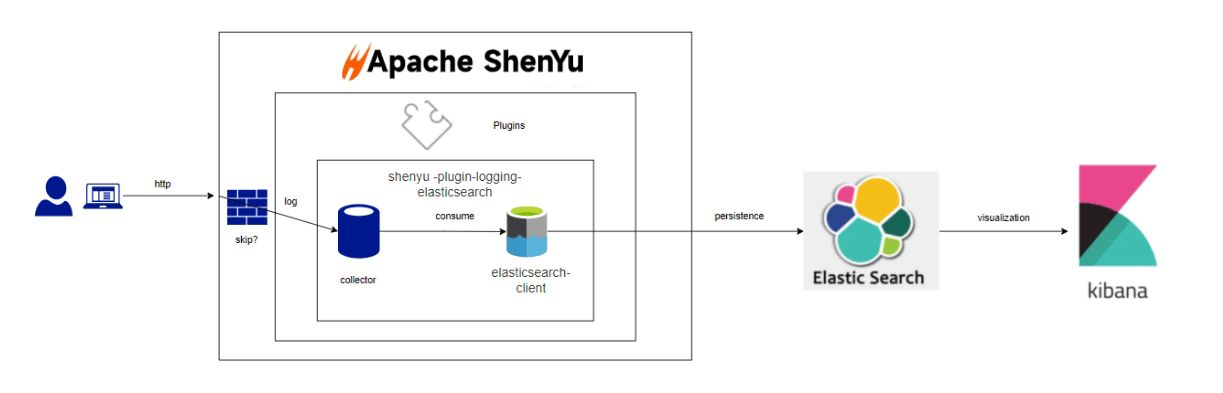
Apache ShenYuThe gateway receives requests from the client, forwards them to the server, and returns the server results to the client. The gateway can record the details of each request,
The list includes: request time, request parameters, request path, response result, response status code, time consumption, upstream IP, exception information waiting. Shenyu gateway can record access logs through logging-elasticsearch-plugin and send access logs to elasticsearch database.
1.4 Plugin code
-
Core Module
shenyu-plugin-logging-elasticsearch -
Core Class
org.apache.shenyu.plugin.logging.elasticsearch.LoggingElasticSearchPlugin -
Core Class
org.apache.shenyu.plugin.logging.elasticsearch.client.ElasticSearchLogCollectClient
1.5 Added Since Which shenyu version
- Since 2.5.0
1.6 Technical Solutions
- Architecture Diagram
2. How to use plugin
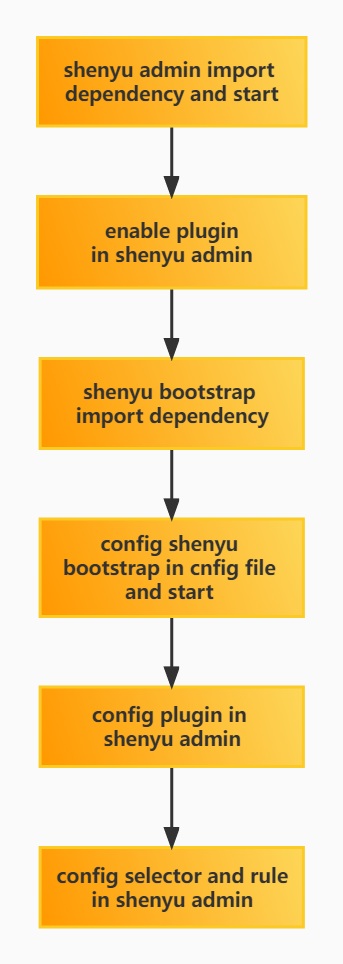
2.1 Plugin-use procedure chart
2.2 Import pom
- Add the dependency of logging-elasticsearch to the Shenyu-bootstrap-module 's
pom.xmlfile.
 <!--shenyu logging-elasticsearch plugin start-->
<dependency>
    <groupId>org.apache.shenyu</groupId>
    <artifactId>shenyu-spring-boot-starter-plugin-logging-elasticsearch</artifactId>
    <version>${project.version}</version>
</dependency>
<!--shenyu logging-elasticsearch plugin end-->
2.3 Enable plugin
- In
shenyu-admin--> Basic Configuration --> Plugin Management -->loggingElasticSearch, configure the ElasticSearch parameter and set it to on.
2.4 Config plugin
2.4.1 Open the plugin and configure elasticsearch, configure it as follows.
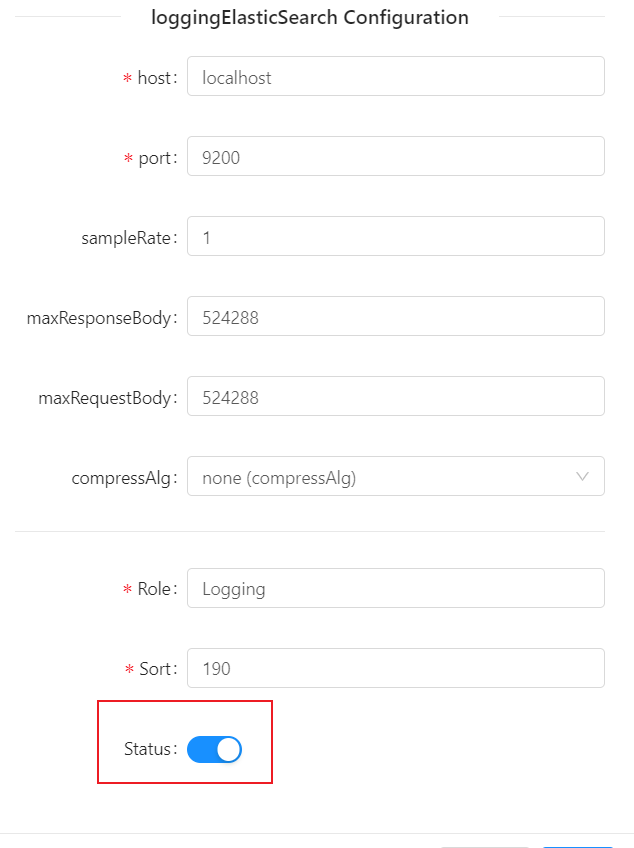
- The individual configuration items are described as follows:
| config-item | type | description | remarks |
|---|---|---|---|
| host | String | host name | must |
| port | String | port num | must |
| sampleRate | String | Sampling rate, range 0~1, 0: off, 0.01: acquisition 1%, 1: acquisition 100% | Optional, default 1, all collection |
| compressAlg | String | Compression algorithm, no compression by default, currently supports LZ4 compression | Optional, no compression by default |
| maxResponseBody | Ingeter | Maximum response size, above the threshold no response will be collected | Optional, default 512KB |
| maxRequestBody | Ingeter | Maximum request body size, above the threshold no request body will be collected | Optional, default 512KB |
| Except for host, port, all others are optional, in most cases only these 3 items need to be configured. |
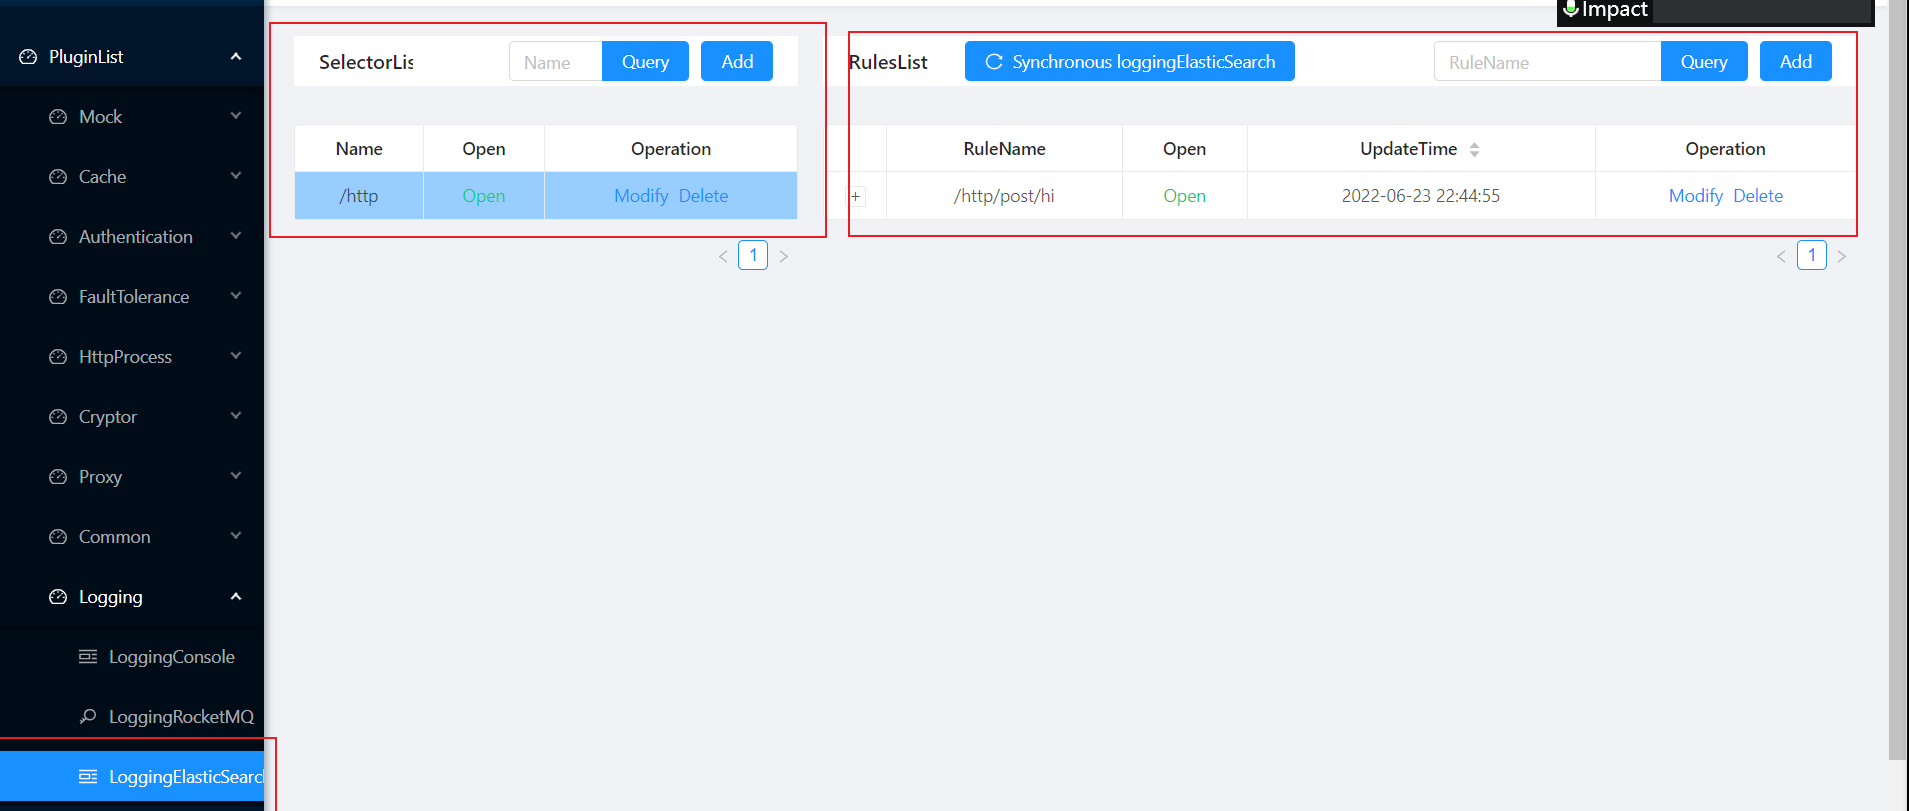
2.4.2 Configuring Selectors and Rulers
For detailed configuration of selectors and rules, please refer to: Selector and rule management。
In addition sometimes a large gateway cluster corresponds to multiple applications (business), different applications (business) corresponds to different topics, related to isolation,
then you can configure different topics (optional) and sampling rate (optional) by selector, the meaning of the configuration items as shown in the table above.
The operation is shown below:
2.5 Logging information
The fields of the captured access log are as follows.
| Field Name | Meaning | Description | Remarks |
|---|---|---|---|
| clientIp | Client IP | ||
| timeLocal | Request time string, format: yyyy-MM-dd HH:mm:ss.SSS | ||
| method | request method (different rpc type is not the same, http class for: get, post wait, rpc class for the interface name) | ||
| requestHeader | Request header (json format) | ||
| responseHeader | Response header (json format) | ||
| queryParams | Request query parameters | ||
| requestBody | Request Body (body of binary type will not be captured) | ||
| requestUri | Request uri | ||
| responseBody | Response body | ||
| responseContentLength | Response body size | ||
| rpcType | rpc type | ||
| status | response status | ||
| upstreamIp | Upstream (program providing the service) IP | ||
| upstreamResponseTime | Time taken by the upstream (program providing the service) to respond to the request (ms ms) | ||
| userAgent | Requested user agent | ||
| host | The requested host | ||
| module | Requested modules | ||
| path | The requested path | ||
| traceId | Requested Link Tracking ID | Need to access link tracking plugins, such as skywalking,zipkin |
2.6 Examples
2.6.1 Collect Http Log by ElasticSearch
2.6.1.1 Install ElasticSearch
Users need to deploy the ElasticSearch service to collect
2.6.1.1.1 Installing ElasticSearch under Windows Environment
- To download address Select Windows version to download
- After downloading the installation package, unzip it, enter the
bindirectory, and double-click to executeelasticsearch.batto start - The default startup port is
9200. Accesshttp://localhost:9200, verify success

2.6.1.1.2 Installing ElasticSearch in MacOS environment
- To download address Select Windows version to download
- After downloading the installation package, unzip it, enter the
bindirectory and execute the startup command on the terminal:./elasticsearch - The default startup port is
9200. Accesshttp://localhost:9200, verify success
2.6.1.2 Install Kibana
2.6.1.2.1 Installing Kibana under Windows Environment
- To download address Select Windows version to download
- After downloading the installation package, unzip it, enter the
bindirectory, and double-click to executekibana.batto start - The default startup port is
5601. Accesshttp://localhost:5601, verify success

2.6.1.2.2 Installing Kibana in MacOS environment
- To download address Select Windows version to download
- After downloading the installation package, unzip it, enter the
bindirectory and execute the startup command on the terminal:./kibana - The default startup port is
5601. Accesshttp://localhost:5601, verify success
2.6.1.3 Plugin Configuration
2.6.1.4 Selector and Rule Configuration
- For detailed configuration of selectors and rules, please refer to:Selector and rule management。
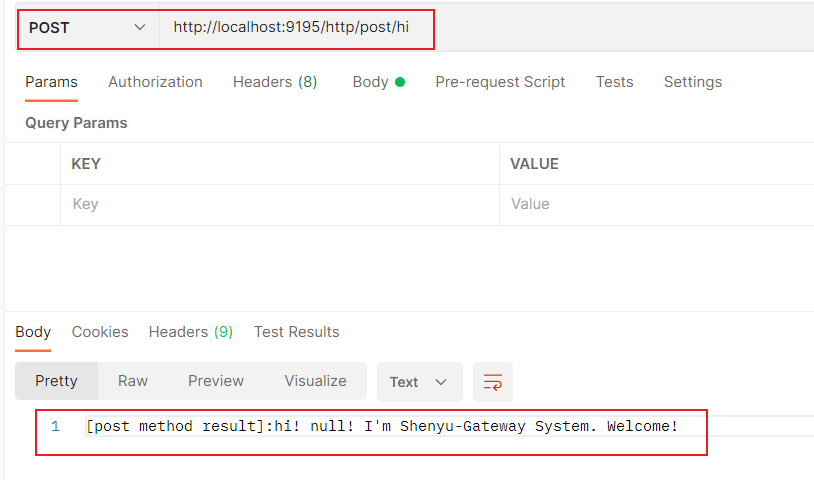
2.6.1.5 Using postman to initiate a request
2.6.1.6 Querying data using kibana

- The first time you use the plug-in, you will automatically create a
shenyu-access-loggingindex
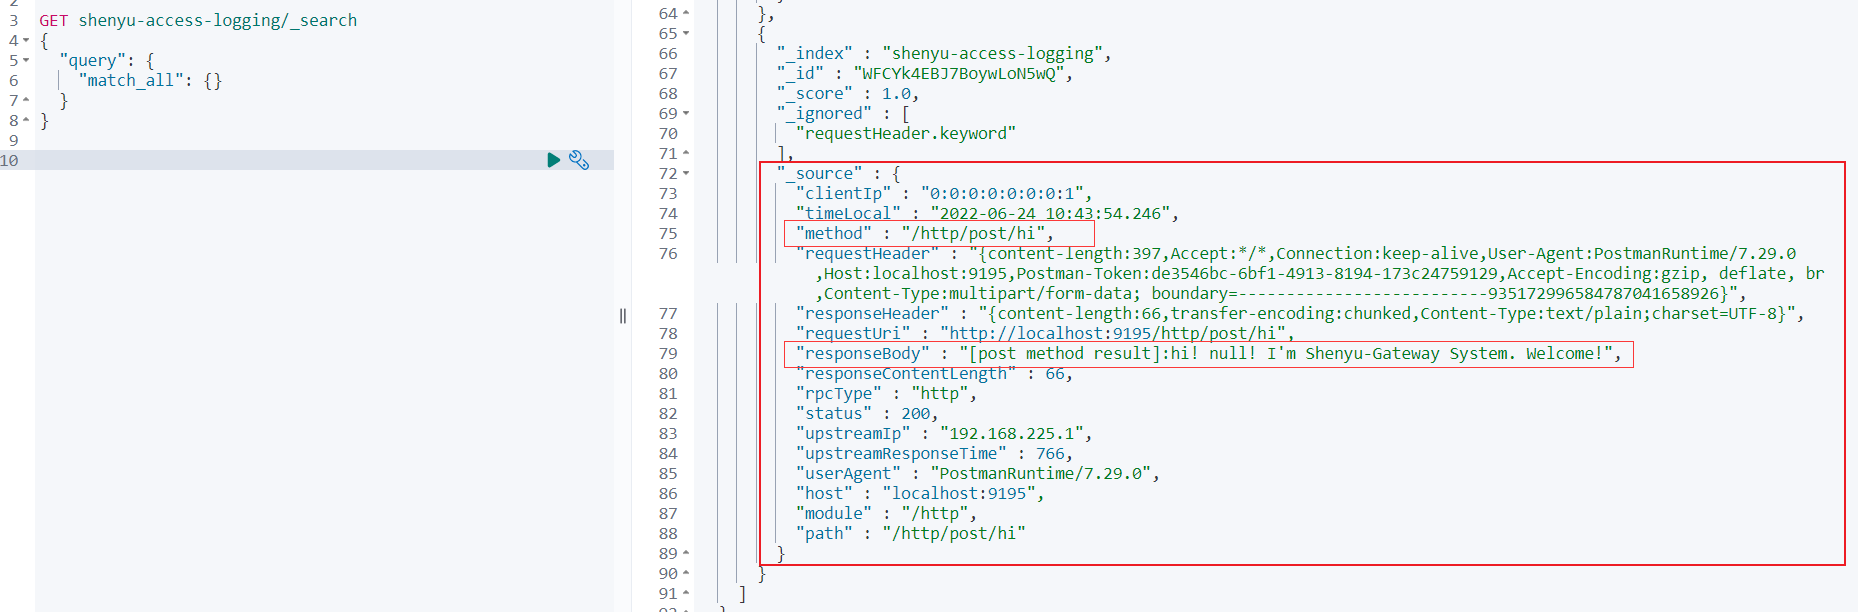
- Using ES query statement, the requested log information can be queried
3. How to disable plugin
- In
shenyu-admin--> BasicConfig --> Plugin -->LoggingElasticSearchset Status disable.