链路追踪接入
此篇文章是介绍如何使用 Apache ShenYu Agent中的tracing功能。
目录结构
.
├── conf
│   ├── logback.xml
│   ├── shenyu-agent.yaml
│   └── tracing-point.yaml
├── plugins
│   ├── shenyu-agent-plugin-tracing-common-${latest.release.version}.jar
│   ├── shenyu-agent-plugin-tracing-jaeger-${latest.release.version}.jar
│   ├── shenyu-agent-plugin-tracing-opentelemetry-${latest.release.version}.jar
│   └── shenyu-agent-plugin-tracing-zipkin-${latest.release.version}.jar
└── shenyu-agent.jar
配置文件
配置文件 shenyu-agent.yaml 位于 shenyu-agent-dist 模块中:
appName: shenyu-agent
supports:
  tracing:
    - jaeger
    - opentelemetry
    - zipkin

plugins:
  tracing:
    jaeger:
      host: "localhost"
      port: 5775
      props:
        SERVICE_NAME: "shenyu-agent"
        JAEGER_SAMPLER_TYPE: "const"
        JAEGER_SAMPLER_PARAM: "1"
    zipkin:
      host: "localhost"
      port: 9411
      props:
        SERVICE_NAME: "shenyu-agent"
        URL_VERSION: "/api/v2/spans"
        SAMPLER_TYPE: "const"
        SAMPLER_PARAM: "1"
    opentelemetry:
      props:
        otel.traces.exporter: jaeger #zipkin #otlp
        otel.resource.attributes: "service.name=shenyu-agent"
        otel.exporter.jaeger.endpoint: "http://localhost:14250/api/traces"
- 在 supports 中选择要使用的插件,如果不需要则去除。
- 在 plugins 中配置插件的参数,其中各插件props参数的具体使用见下面几个表格:
jaeger
| 名称 | 类型 | 默认值 | 说明 |
|---|---|---|---|
| SERVICE_NAME | String | shenyu-agent | 在traces系统中显示的名称 |
| JAEGER_SAMPLER_TYPE | String | const | Jaeger 采样率类型 |
| JAEGER_SAMPLER_PARAM | String | 1 | Jaeger 采样率参数 |
opentelemetry
| 名称 | 类型 | 默认值 | 说明 |
|---|---|---|---|
| otel.traces.exporter | String | jaeger | traces导出器类型,若不填默认是otlp |
| otel.resource.attributes | String | service.name=shenyu-agent | otel资源属性,若填写多个,可用逗号分隔 |
opentelemetry 插件使用的sdk基于 opentelemetry-sdk-extension-autoconfigure 初始化,更多使用请参考 OpenTelemetry SDK自动配置说明
zipkin
| 名称 | 类型 | 默认值 | 说明 |
|---|---|---|---|
| SERVICE_NAME | String | shenyu-agent | 在traces系统中显示的名称 |
| URL_VERSION | String | /api/v2/spans | Zipkin的版本 |
| SAMPLER_TYPE | String | const | Zipkin 采样率类型 |
| SAMPLER_PARAM | String | 1 | Zipkin 采样率参数 |
使用 jaeger 插件
- 修改配置文件
在 shenyu-agent.yaml 文件中通过supports.tracing指定使用 jaeger 插件,通过 plugins.tracing 填写 jaeger 的配置信息。
appName: shenyu-agent
supports:
  tracing:
    - jaeger

plugins:
  tracing:
    jaeger:
      host: "localhost"
      port: 5775
      props:
        SERVICE_NAME: "shenyu-agent"
        JAEGER_SAMPLER_TYPE: "const"
        JAEGER_SAMPLER_PARAM: "1"
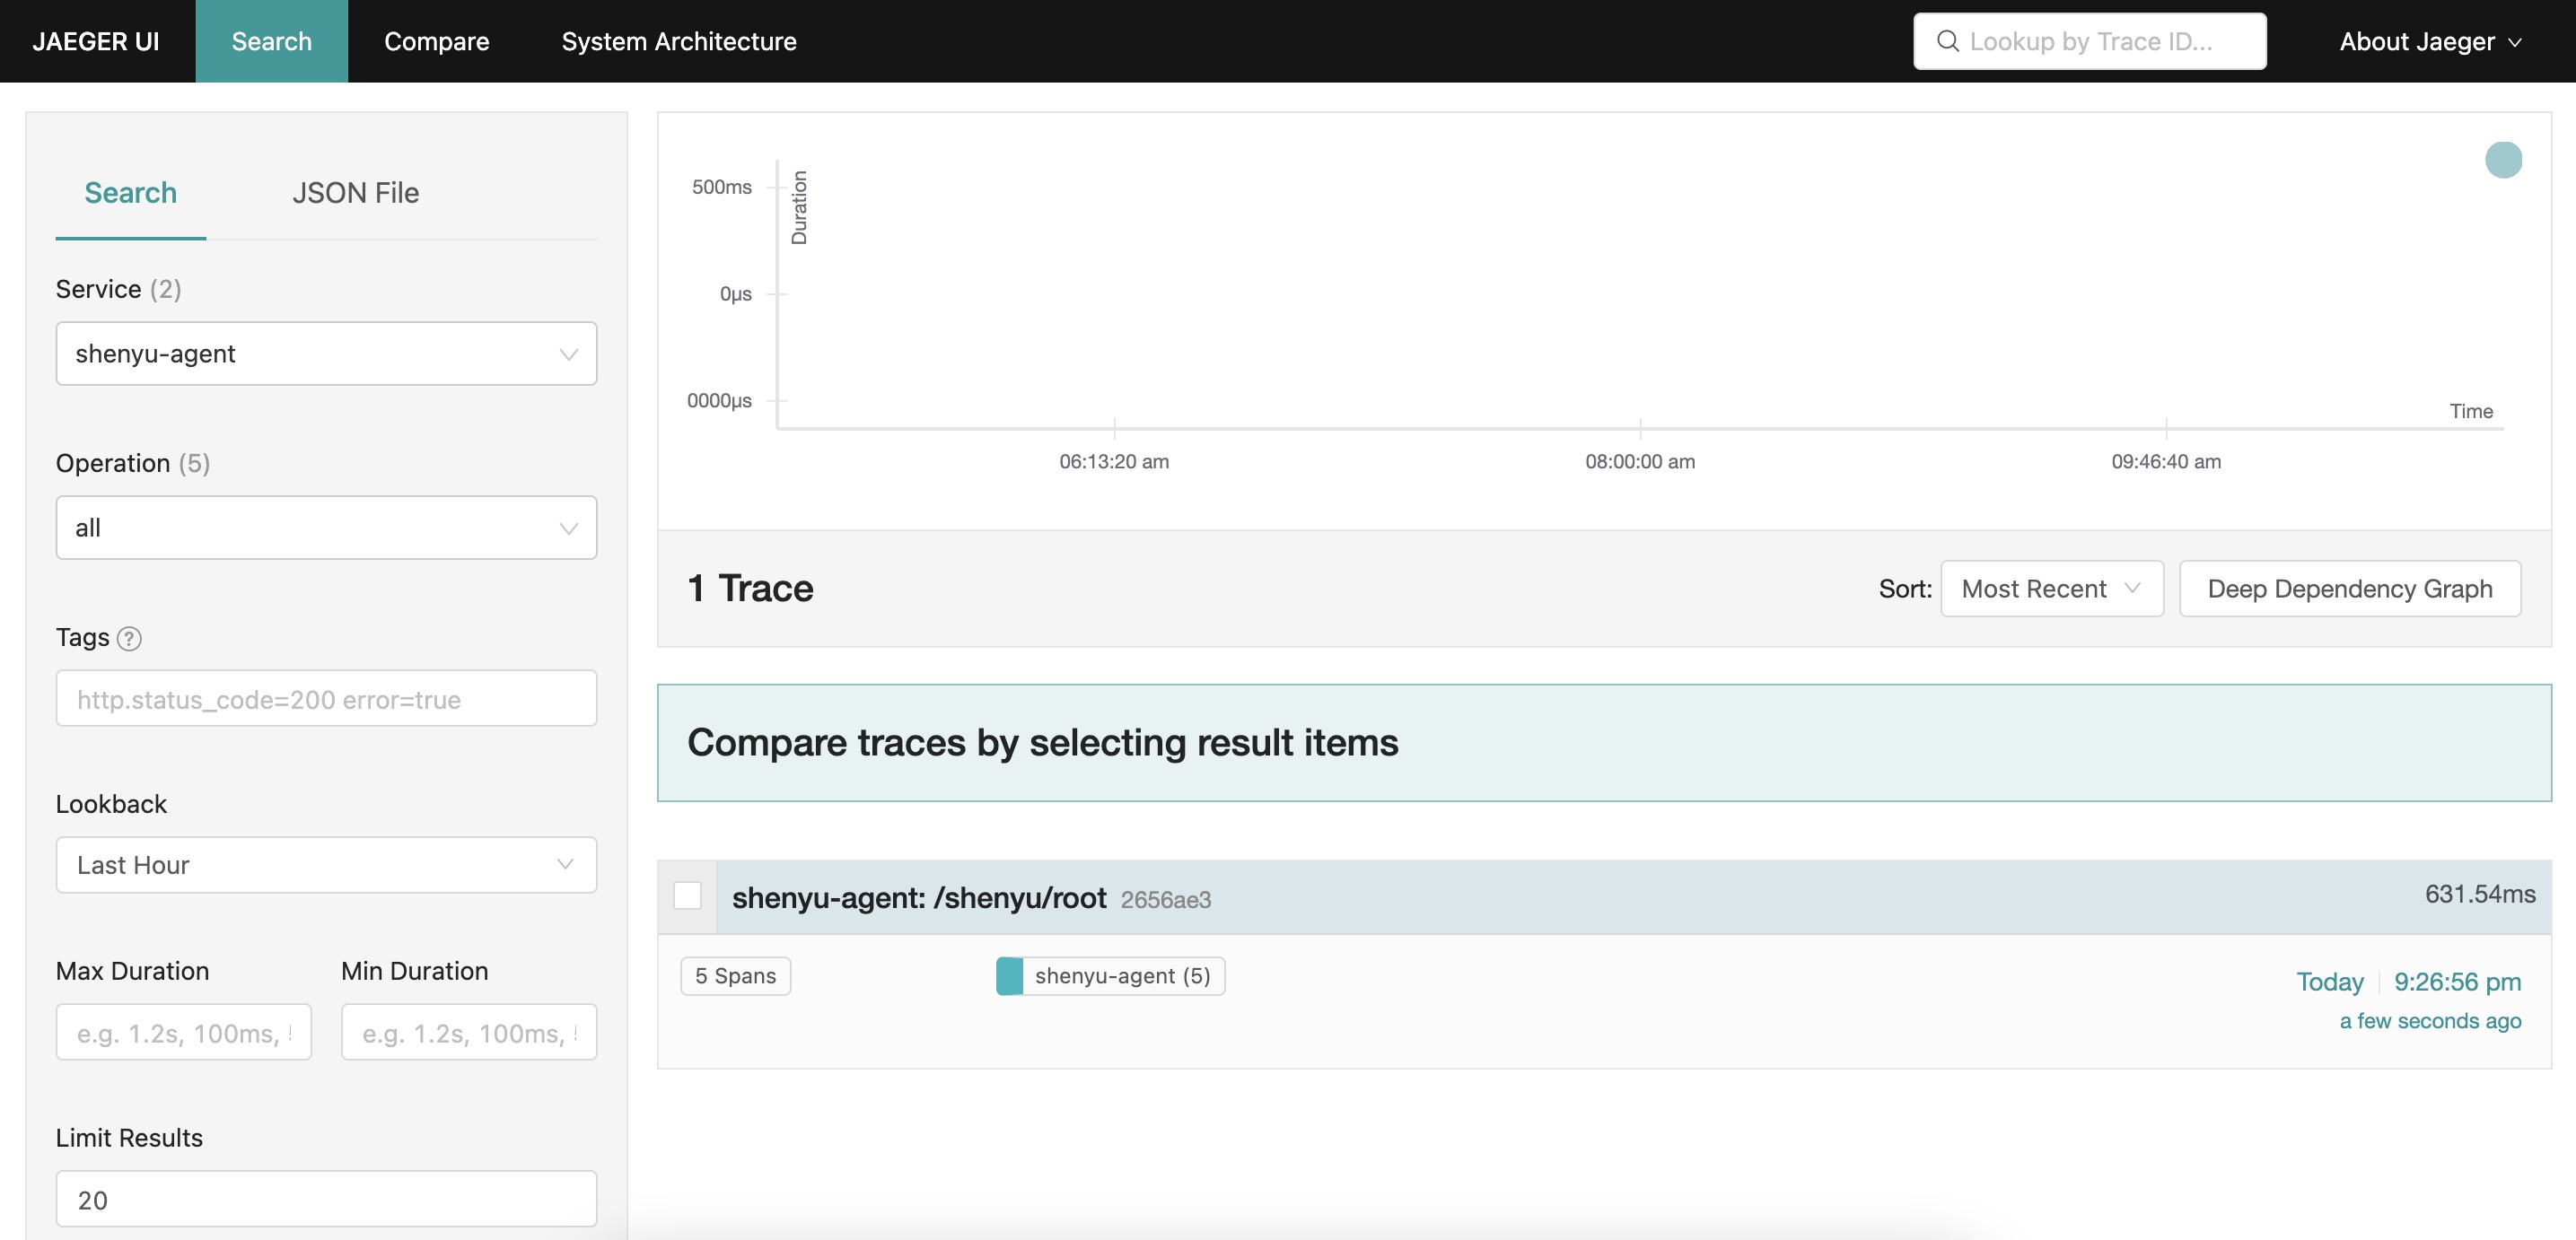
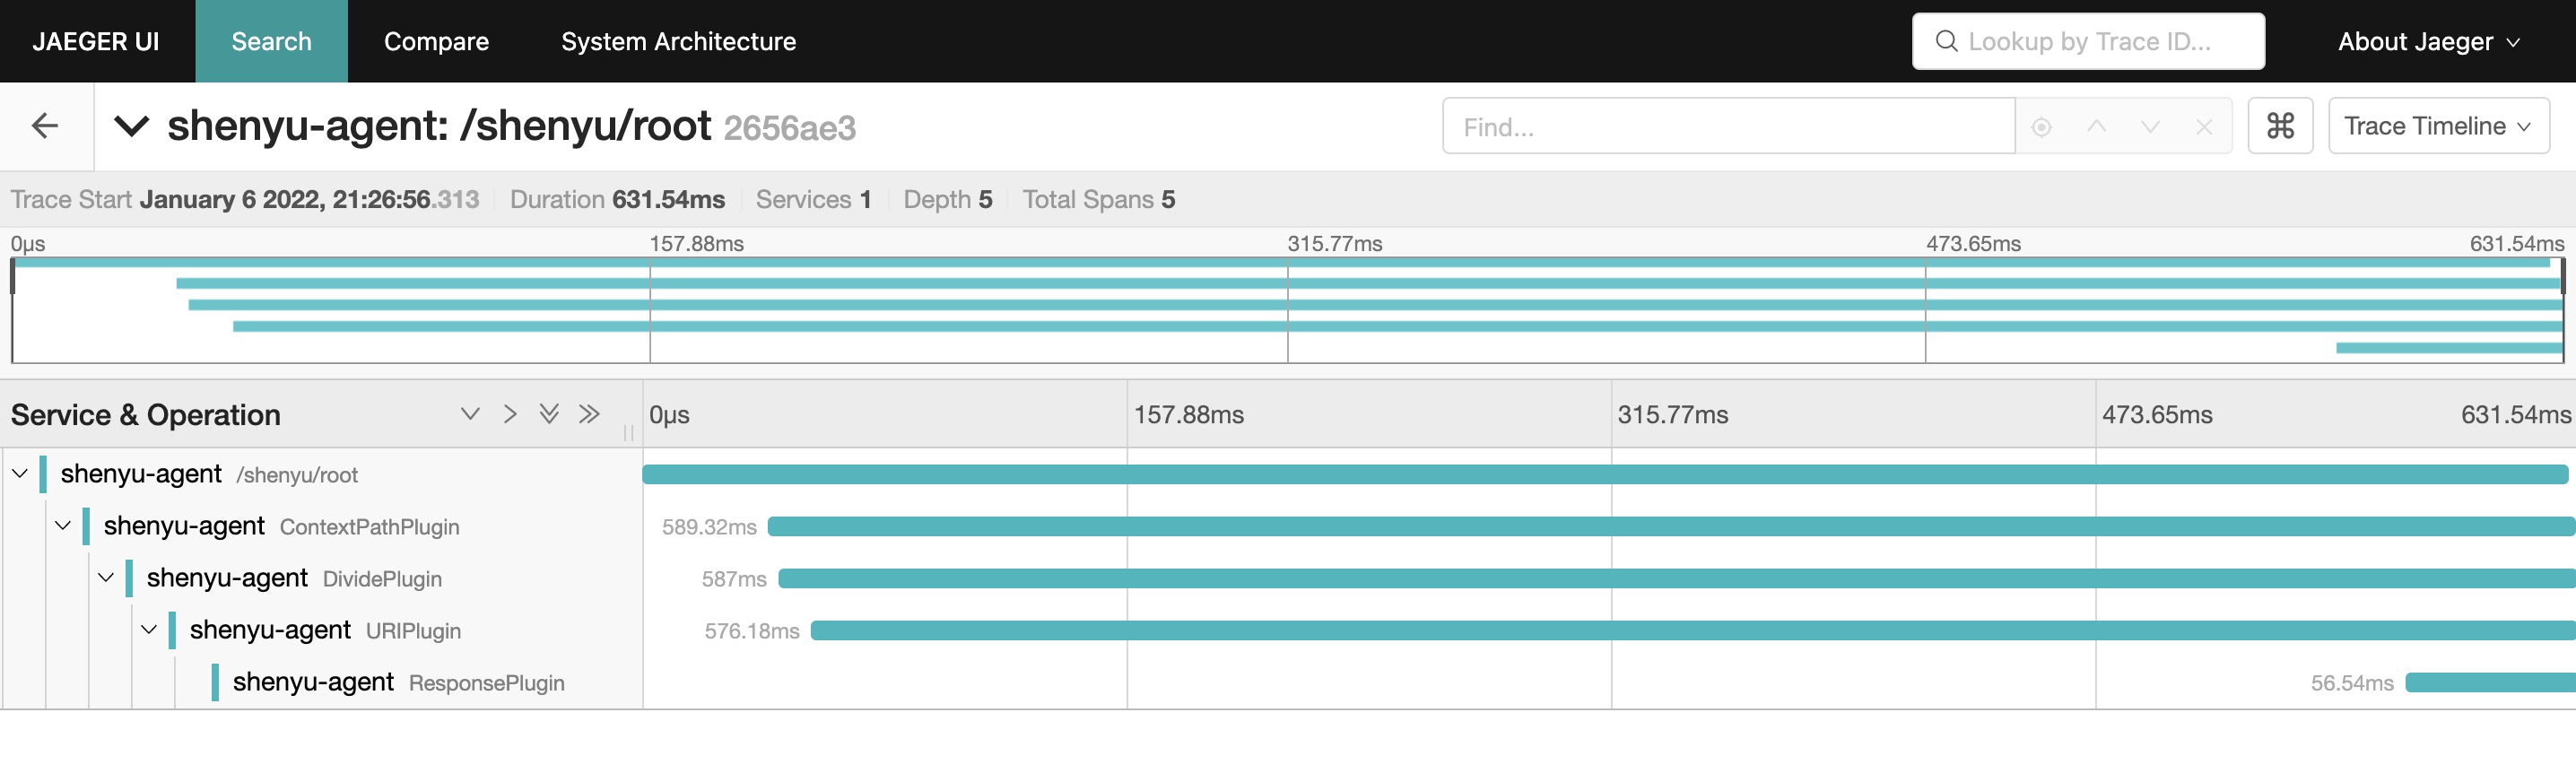
- 启动 jaeger 服务
请参考 jaeger-quickstart 启动 jaeger
-
测试
GET http://localhost:9195/http/order/findById?id=1
Accept: application/json
-
请求成功后,可以看到链路日志已经上报到 jaeger 中:
使用 zipkin 插件
- 修改配置文件
在 shenyu-agent.yaml 文件中通过supports.tracing指定使用 zipkin 插件,通过 plugins.tracing 填写 zipkin 的配置信息。
appName: shenyu-agent
supports:
  tracing:
    - zipkin

plugins:
  tracing:
    zipkin:
      host: "localhost"
      port: 9411
      props:
        SERVICE_NAME: "shenyu-agent"
        URL_VERSION: "/api/v2/spans"
        SAMPLER_TYPE: "const"
        SAMPLER_PARAM: "1"
- 启动 zipkin-server
请参考 zipkin-quickstart 启动 zipkin-server 。
-
测试
GET http://localhost:9195/http/order/findById?id=999
Accept: application/json
- 请求成功后,可以看到链路日志已经上报到zipkin中:
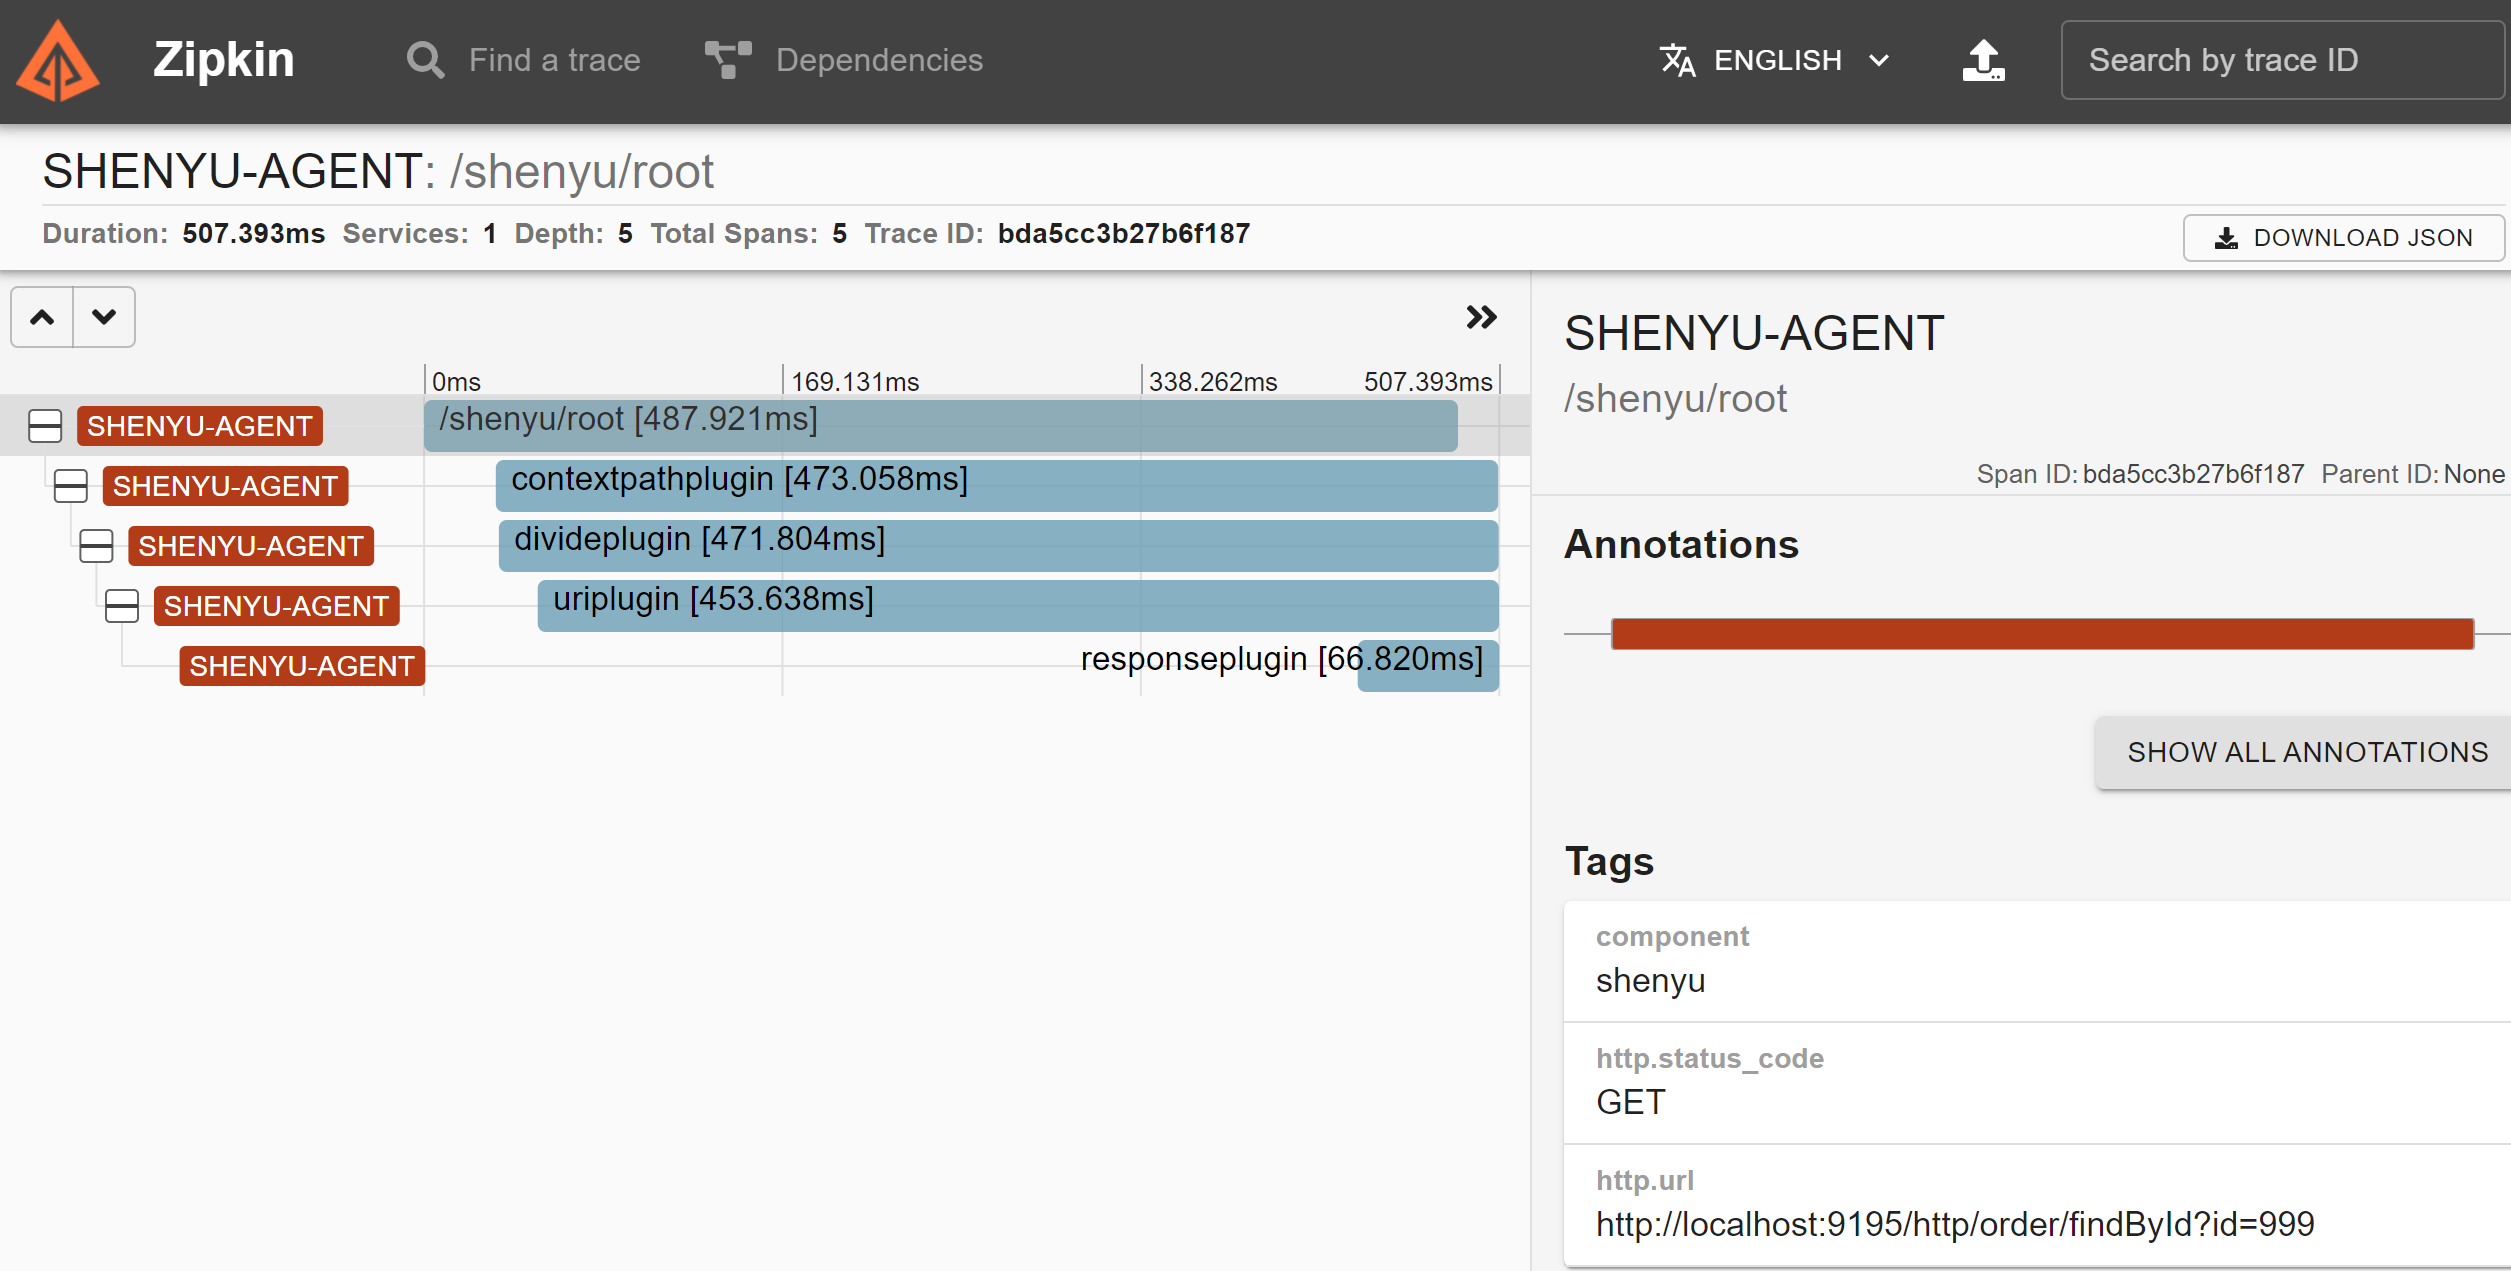
- 请求成功后,可以看到链路日志已经上报到zipkin中:
使用 opentelemetry 插件
- 修改配置文件
在 shenyu-agent.yaml 文件中通过supports.tracing指定使用 opentelemetry 插件,通过 plugins.tracing 填写 opentelemetry 的配置信息。
appName: shenyu-agent
supports:
  tracing:
    - opentelemetry

plugins:
  tracing:
    opentelemetry:
      props:
        otel.traces.exporter: jaeger #zipkin #otlp
        otel.resource.attributes: "service.name=shenyu-agent"
        otel.exporter.jaeger.endpoint: "http://localhost:14250/api/traces"
- 根据导出器配置启动 jaeger 或 zipkin 或 opentelemetry-collector
启动 jaeger 可参考 jaeger-quickstart
启动 zipkin 可参考 zipkin-quickstart
启动 otel-collector 可参考 opentelemetry-collector-quickstart
-
测试
GET http://localhost:9195/http/order/findById?id=1
Accept: application/json
- 请求成功后,可在相应后端看到链路日志,效果与上面的jaeger插件和zipkin插件相同。