Tracing
This article introduces how to use the Apache ShenYu Agent Tracing.
Apache ShenYu uses java agent and bytecode enhancement technology to achieve seamless embedding, so that users can access third-party observability systems without introducing dependencies, and obtain Traces, Metrics and Logging.
Catalog Structure
.
├── conf
│   ├── logback.xml
│   ├── shenyu-agent.yaml
│   └── tracing-point.yaml
├── plugins
│   ├── shenyu-agent-plugin-tracing-common-${latest.release.version}.jar
│   ├── shenyu-agent-plugin-tracing-jaeger-${latest.release.version}.jar
│   ├── shenyu-agent-plugin-tracing-opentelemetry-${latest.release.version}.jar
│   └── shenyu-agent-plugin-tracing-zipkin-${latest.release.version}.jar
└── shenyu-agent.jar
Edit shenyu-agent.yaml
appName: shenyu-agent
supports:
  tracing:
    - jaeger
    - opentelemetry
    - zipkin

plugins:
  tracing:
    jaeger:
      host: "localhost"
      port: 5775
      props:
        SERVICE_NAME: "shenyu-agent"
        JAEGER_SAMPLER_TYPE: "const"
        JAEGER_SAMPLER_PARAM: "1"
    zipkin:
      host:
      port:
      props:
    opentelemetry:
      props:
        otel.traces.exporter: jaeger #zipkin #otlp
        otel.resource.attributes: "service.name=shenyu-agent"
        otel.exporter.jaeger.endpoint: "http://localhost:14250/api/traces"
- Select the plugin to be used in
supports - Configure the parameters of the plug-in in
plugins. The specific usage of each plug-in props parameter is shown in the following tables:
jaeger
| Name | Type | Default | Description |
|---|---|---|---|
| SERVICE_NAME | String | shenyu-agent | The name displayed in the traces system |
| JAEGER_SAMPLER_TYPE | String | const | Jaeger sample rate type |
| JAEGER_SAMPLER_PARAM | String | 1 | Jaeger sample rate parameters |
opentelemetry
| Name | Type | Default | Description |
|---|---|---|---|
| otel.traces.exporter | String | jaeger | Traces exporter type, if not filled in, the default is otlp |
| otel.resource.attributes | String | service.name=shenyu-agent | otel resource attributes, if you fill in more than one, they can be separated by commas |
The SDK used by the opentelemetry plugin is initialized based on opentelemetry-sdk-extension-autoconfigure. For more usage, please refer to OpenTelemetry SDK AutoConfiguration Instructions
zipkin
| Name | Type | Default | Description |
|---|---|---|---|
| SERVICE_NAME | String | shenyu-agent | The name displayed in the traces system |
| URL_VERSION | String | /api/v2/spans | zipkin url version |
| SAMPLER_TYPE | String | const | zipkin sampler type |
| SAMPLER_PARAM | String | 1 | zipkin sampler param |
Agent Plugin Tracing Jaeger
- modify yaml file
Specify the use of the jaeger plugin via supports.tracing in the shenyu-agent.yaml file, and fill in the jaeger configuration information via plugins.tracing.
appName: shenyu-agent
supports:
  tracing:
    - jaeger

plugins:
  tracing:
    jaeger:
      host: "localhost"
      port: 5775
      props:
        SERVICE_NAME: "shenyu-agent"
        JAEGER_SAMPLER_TYPE: "const"
        JAEGER_SAMPLER_PARAM: "1"
- start jaeger server
please see jaeger-quickstart to start jaeger
-
tracing test
- Reference Deployment to start
shenyu-admin. - Start the gateway by referring to the above procedure.
- Refer to Quick start with Http to start
shenyu-examples-http. - Launch a request to the gateway.
GET http://localhost:9195/http/order/findById?id=1
Accept: application/json
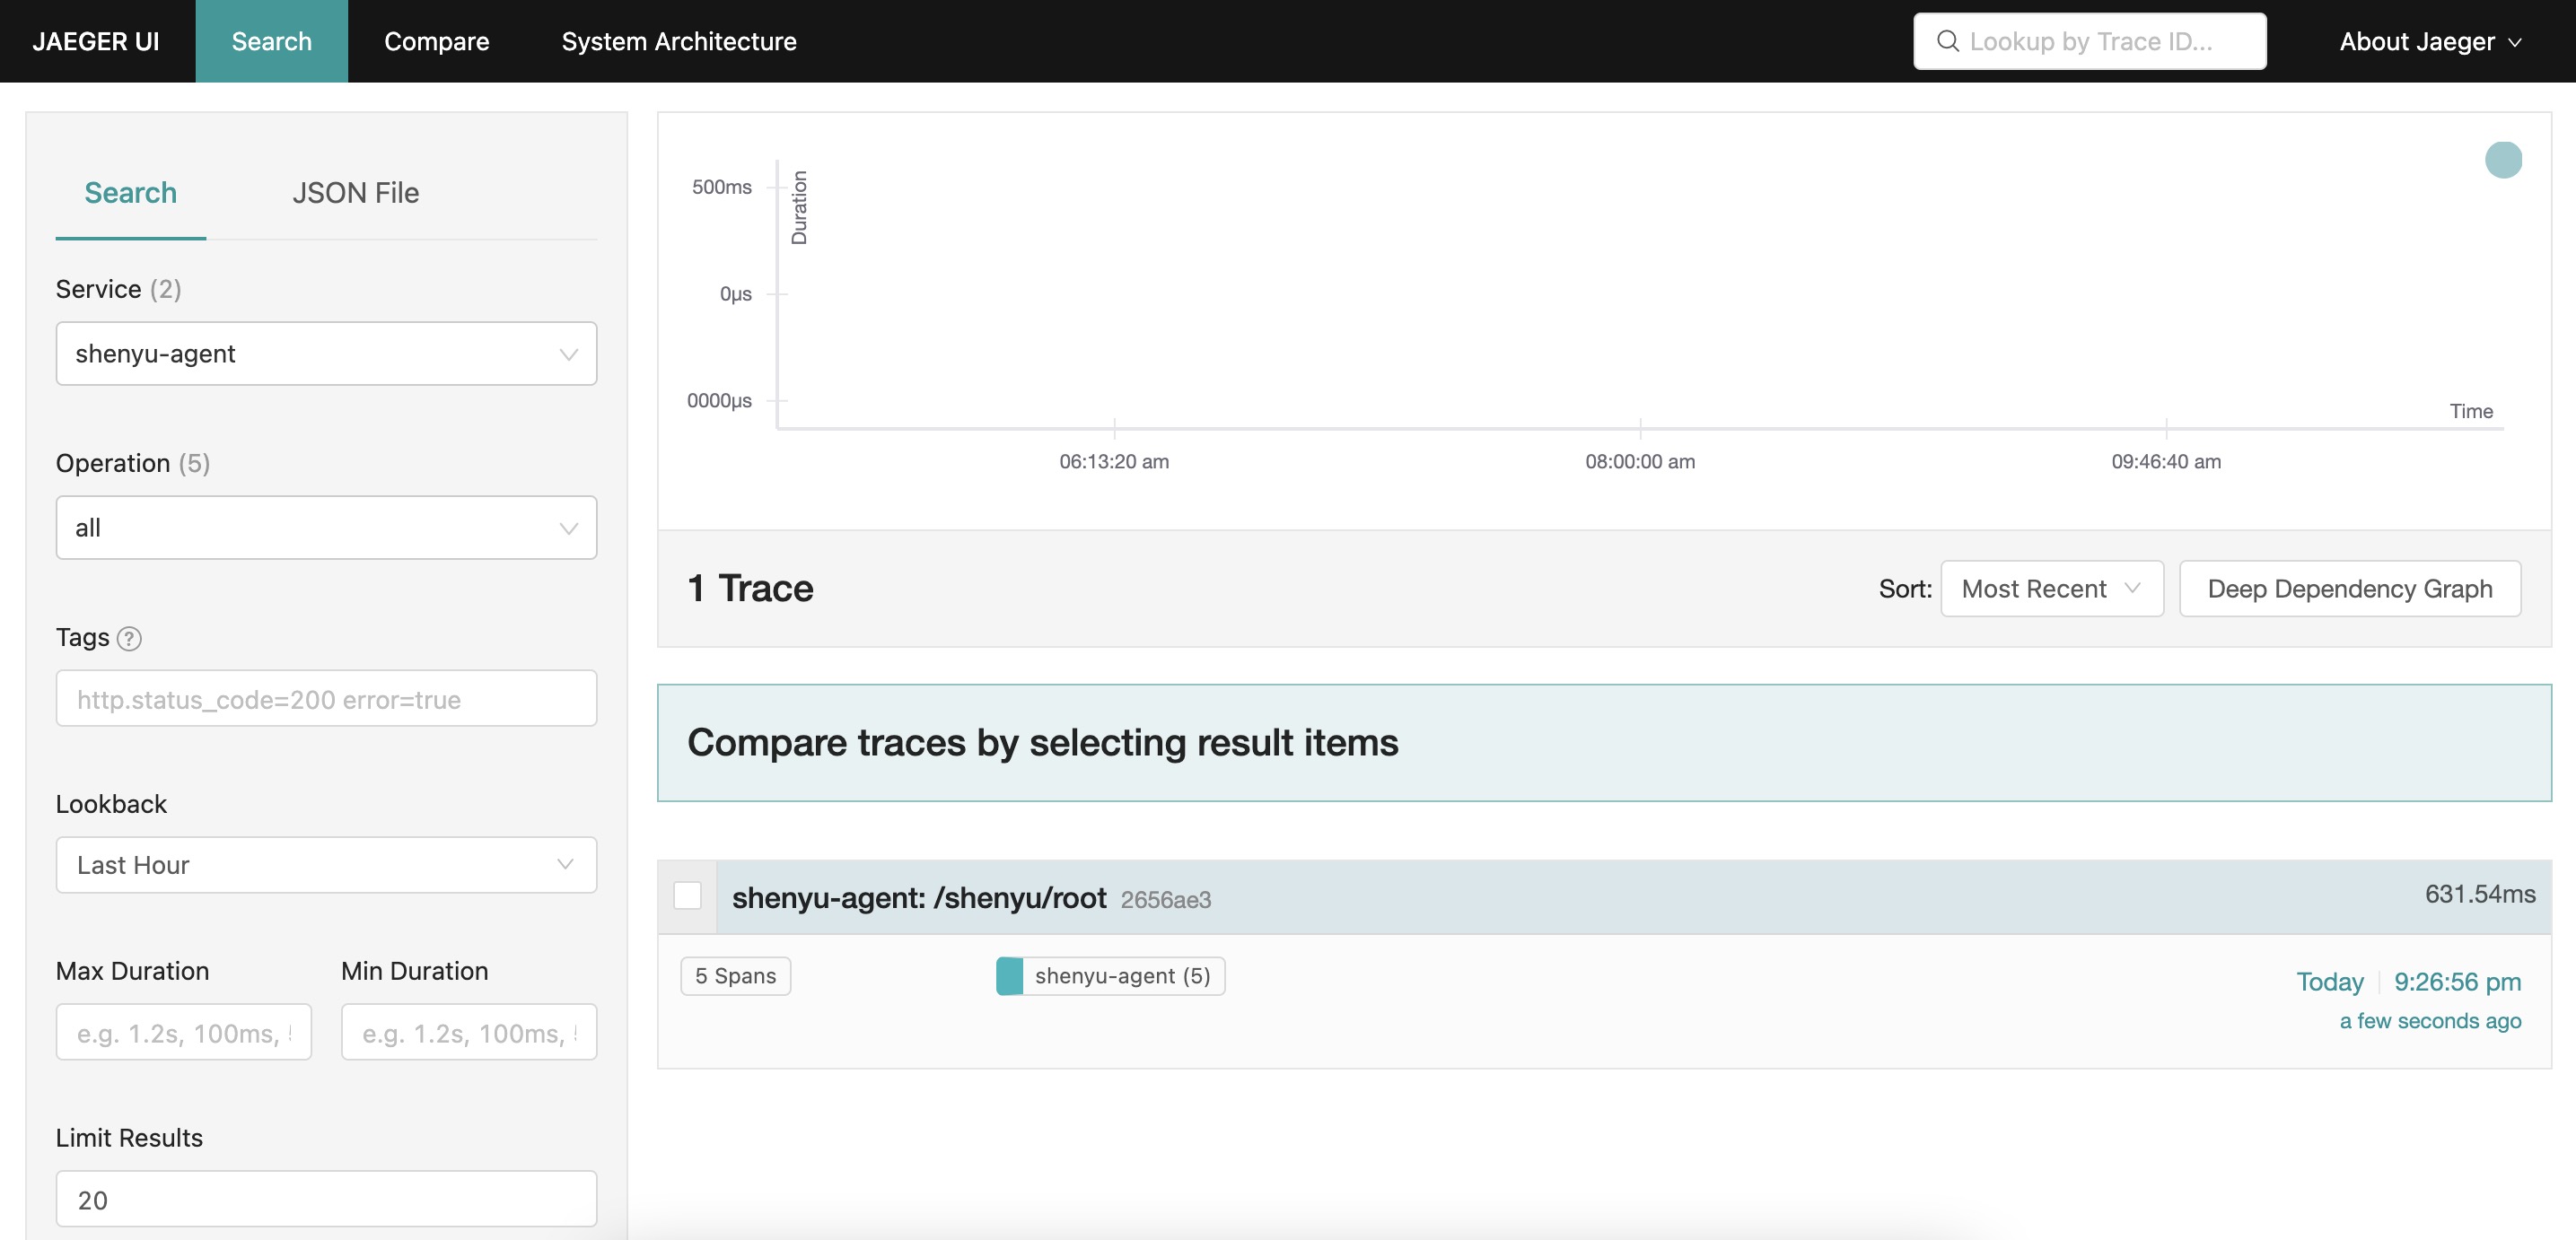
- After a successful request, you can see that the link log has been reported to jaeger:


- Reference Deployment to start
Agent Plugin Tracing Zipkin
- modify yaml file
Specify the use of the zipkin plugin via supports.tracing in the shenyu-agent.yaml file, and fill in the zipkin configuration information via plugins.tracing.
appName: shenyu-agent
supports:
  tracing:
    - zipkin

plugins:
  tracing:
    zipkin:
      host: "localhost"
      port: 9411
      props:
        SERVICE_NAME: "shenyu-agent"
        URL_VERSION: "/api/v2/spans"
        SAMPLER_TYPE: "const"
        SAMPLER_PARAM: "1"
- start zipkin-server
please see zipkin-quickstart to start zipkin-server .
-
tracing test
- Reference Deployment to start
shenyu-admin. - Start the gateway by referring to the above procedure.
- Refer to Quick start with Http to start
shenyu-examples-http. - Launch a request to the gateway.
GET http://localhost:9195/http/order/findById?id=999
Accept: application/json
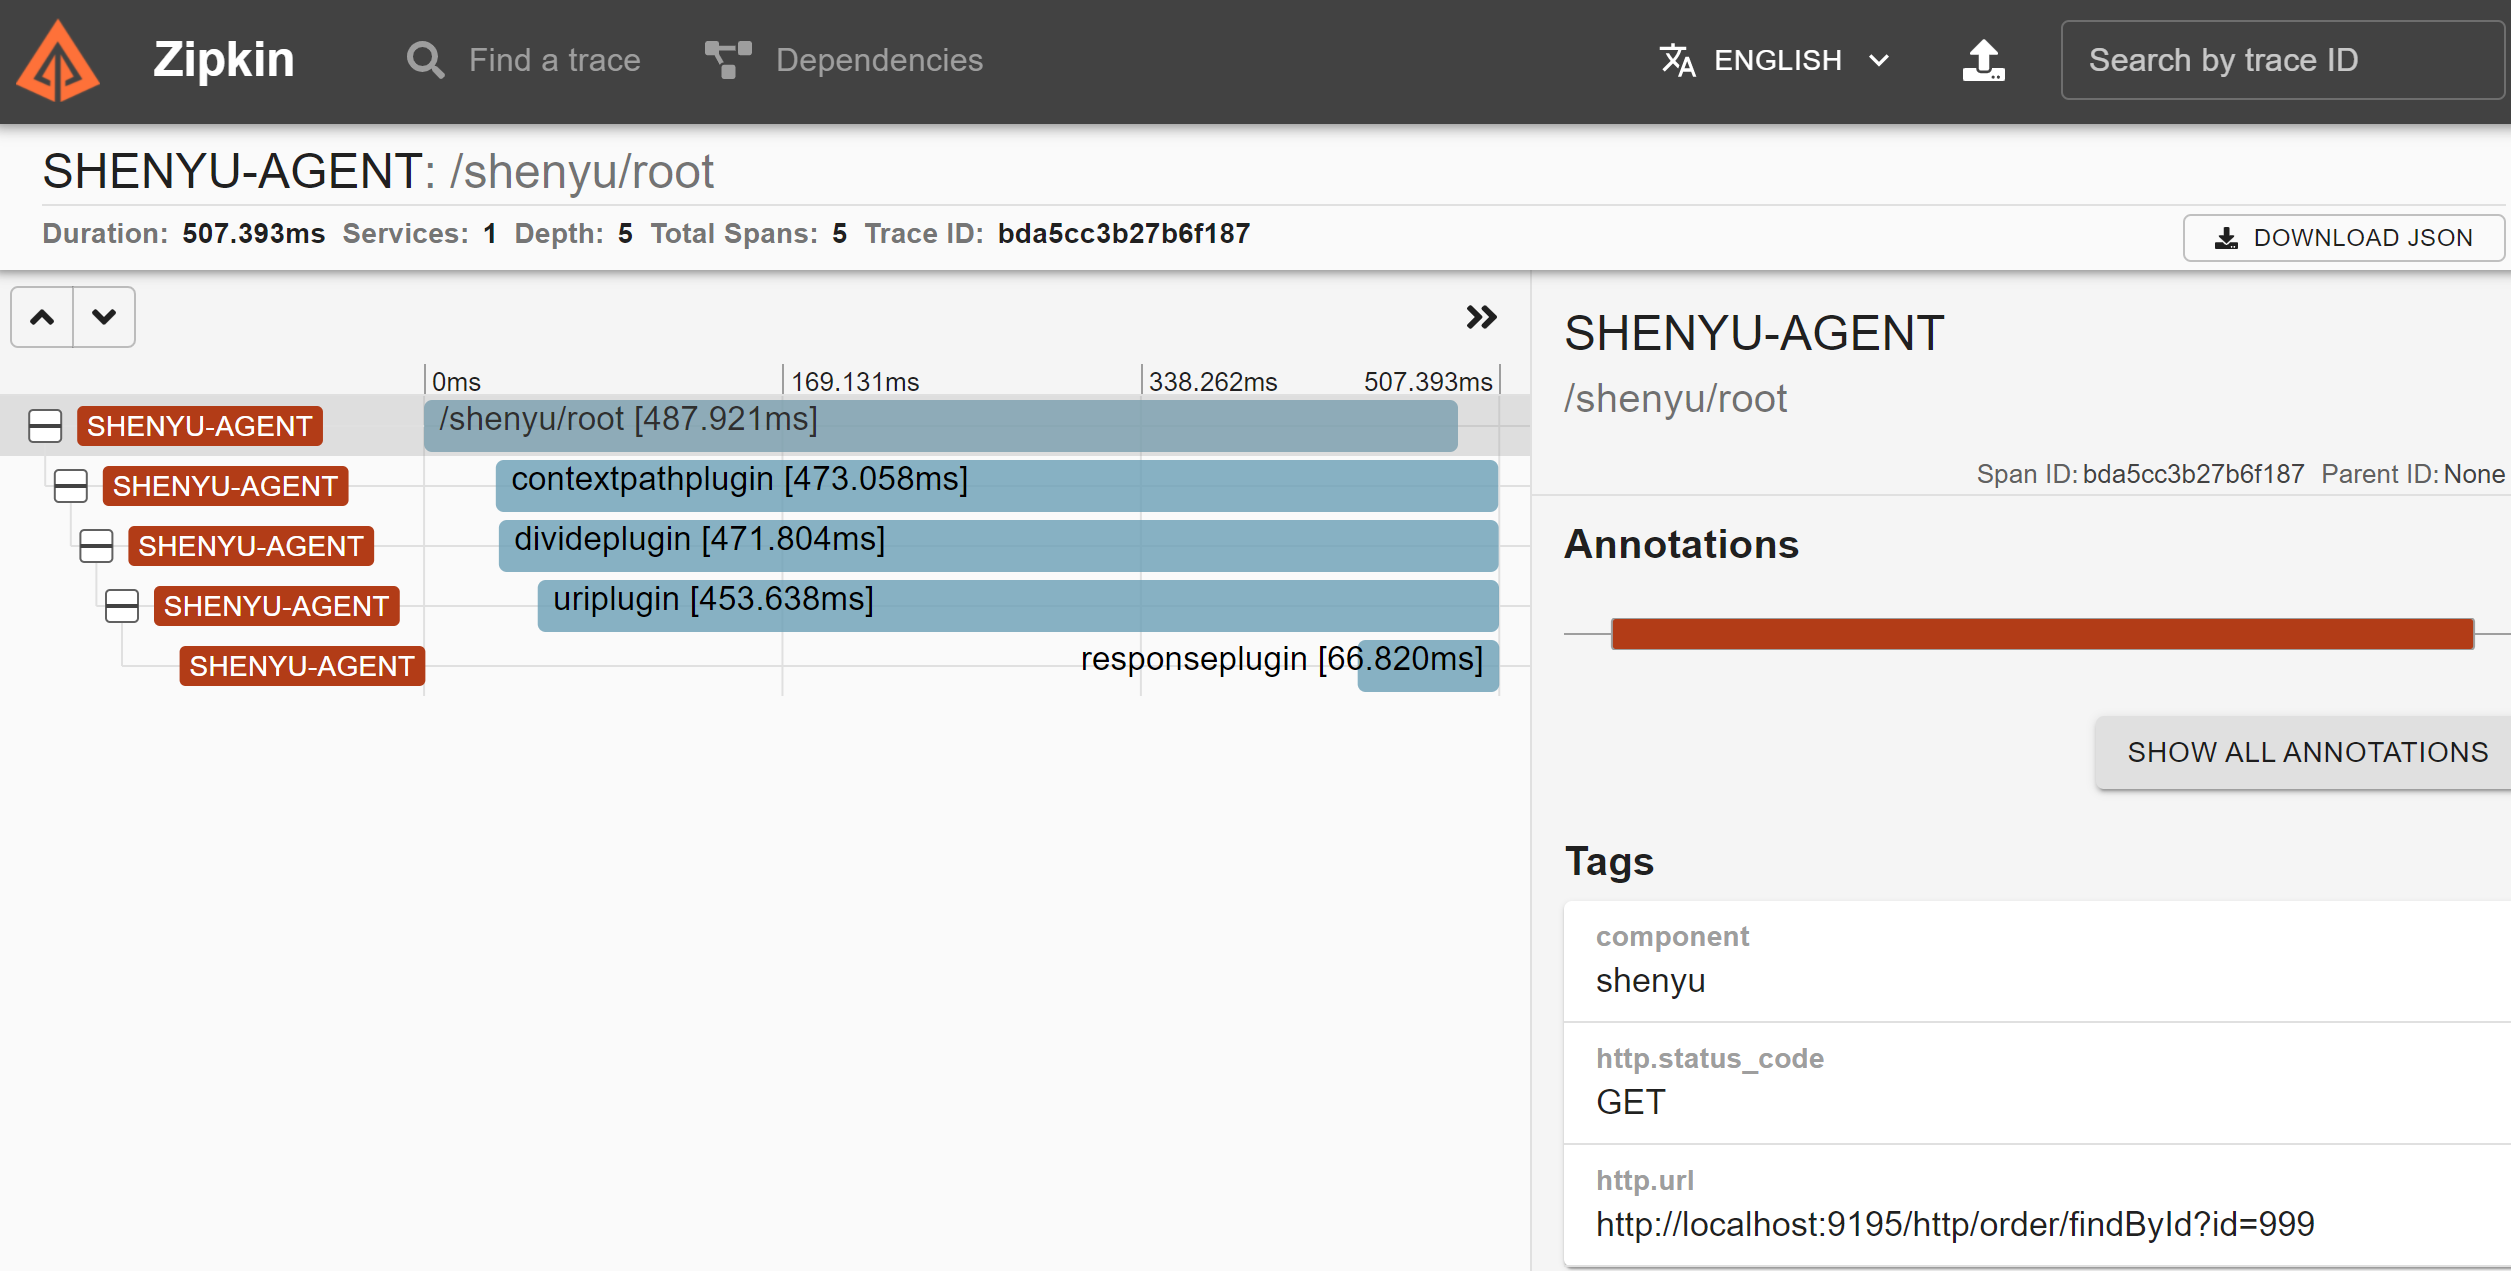
- After a successful request, you can see that the link log has been reported to zipkin:

- Reference Deployment to start
Agent Plugin Tracing OpenTelemetry
- modify yaml file
Specify the use of the opentelemetry plugin via supports.tracing in the shenyu-agent.yaml file, and fill in the opentelemetry configuration information via plugins.tracing.
appName: shenyu-agent
supports:
  tracing:
    - opentelemetry

plugins:
  tracing:
    opentelemetry:
      props:
        otel.traces.exporter: jaeger #zipkin #otlp
        otel.resource.attributes: "service.name=shenyu-agent"
        otel.exporter.jaeger.endpoint: "http://localhost:14250/api/traces"
- Start jaeger or zipkin or opentelemetry-collector according to exporter configuration
To start jaeger, please refer to jaeger-quickstart
To start zipkin, please refer to zipkin-quickstart
To start otel-collector, please refer to opentelemetry-collector-quickstart
-
tracing test
- Reference Deployment to start
shenyu-admin. - Start the gateway by referring to the above procedure.
- Refer to Quick start with Http to start
shenyu-examples-http. - Launch a request to the gateway.
GET http://localhost:9195/http/order/findById?id=999
Accept: application/json
- After the request is successful, you can see the link log in the corresponding backend, the effect is the same as the above
jaegerplugin andzipkinplugin.
- Reference Deployment to start