Monitor Plugin
Description
- Monitor plugin is used to monitor its own running status(JVM-related) by gateway, include request response delay, QPS, TPS, and other related metrics.
Technical Solutions
-
Flow Diagram
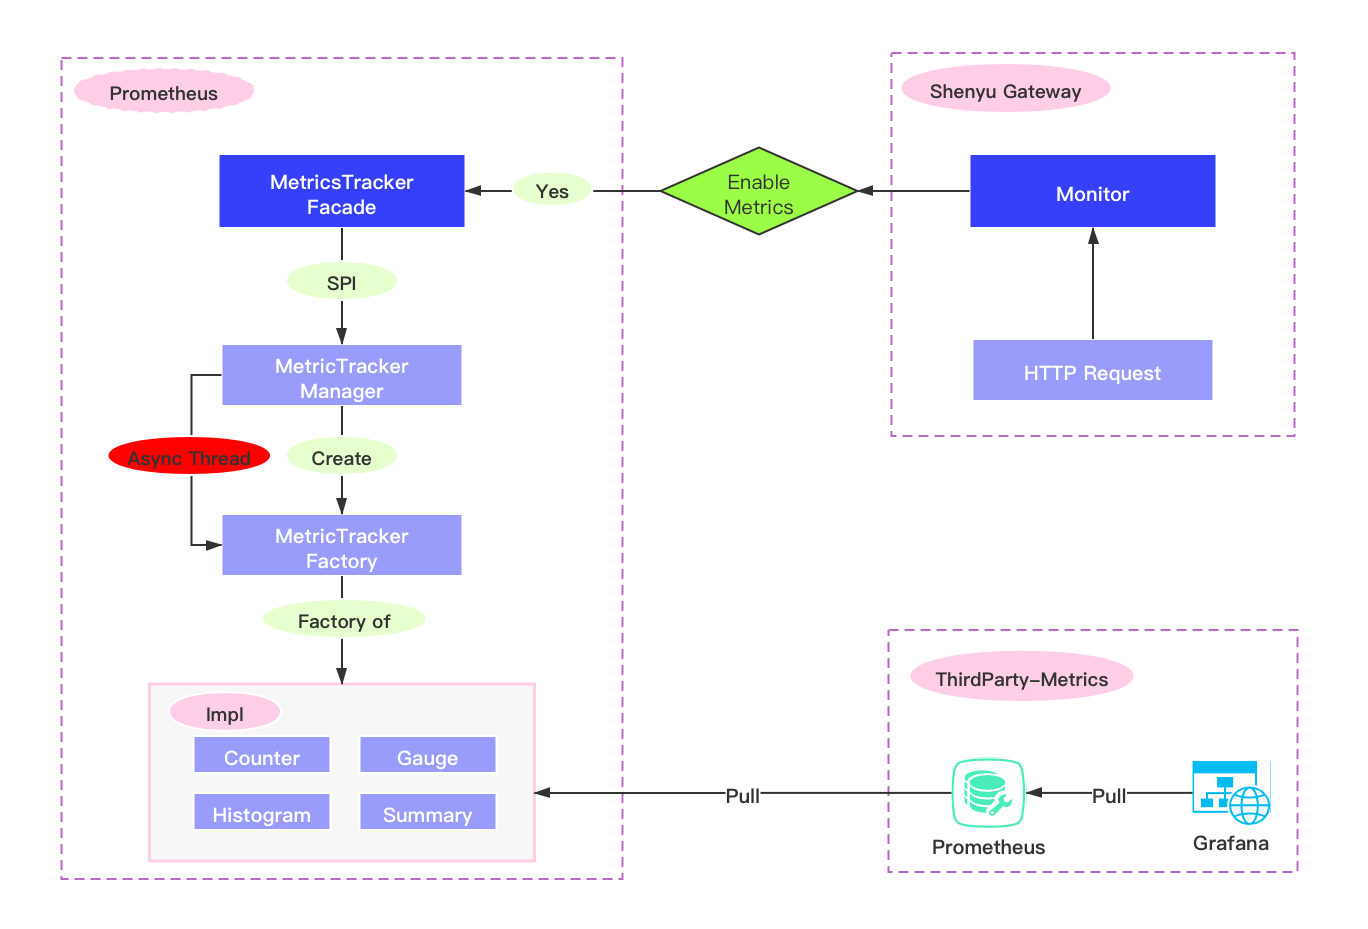
-
Make even tracking in ShenYu Gateway by asynchronous or synchronous mode.
-
The
prometheusserver pulls metrics' through http request, and then displays it byGrafana.
Plugin Setting
- In
shenyu-admin--> BasicConfig --> Plugin --> monitor, set to enable. - Add the following configuration in the monitor plugin.
{"metricsName":"prometheus","host":"localhost","port":"9190","async":"true"}

# port : Pulled ports for exposing to prometheus service.
# host : If not filled in, it is the host of Apache ShenYu Gateway.
# async :"true" is asynchronous event tracking, false is synchronous event tracking.
- If the user don't use, please disable the plugin in the background.
- Introduce
monitordependency in the pom.xml file of the gateway.
  <!-- apache shenyu monitor plugin start-->
  <dependency>
      <groupId>org.apache.shenyu</groupId>
      <artifactId>shenyu-spring-boot-starter-plugin-monitor</artifactId>
      <version>${project.version}</version>
  </dependency>
  <!-- apache shenyu monitor plugin end-->
- Selectors and rules, please refer to: Selector And Rule Config.
- Only when the url is matched, the url will request event tracking.
Metrics Detail
-
All JVM,thread,memory,and other related information will be made event tracking,you can add a JVM module in the Grafana' panel, and it will be fully displayed, please refer to: https://github.com/prometheus/jmx_exporter
-
There are also the following custom
metrics
| Name | type | target | description |
|---|---|---|---|
| request_total | Counter | none | collecting all requests of Apache ShenYu Gateway |
| http_request_total | Counter | path,type | collecting all matched requests of monitor |
Collect metrics
Users need to install Prometheus service to collect
- Choose the corresponding environment download address to install
- Modify configuration file:
prometheus.yml
scrape_configs:
  # The job name is added as a label `job=<job_name>` to any timeseries scraped from this config.
  - job_name: 'prometheus'
    # metrics_path defaults to '/metrics'
    # scheme defaults to 'http'.
    static_configs:
    - targets: ['localhost:9190']
Note: The job_name corresponds to the metricsName of the monitor plug-in configuration
- After the configuration is completed, you can directly double-click
prometheus.exein the window to start. The default boot port is9090, Success can be verified at http://localhost:9090/
Panel Display
It is recommended to use Grafana, Users can customize the query to personalize the display panel.
Here's how to install and deploy Grafana for Windows
- Install Grafana
download Unzip it and enter the bin directory and double-click grafana-server.exe to run it. Go to http://localhost:3000/?orgId=1 admin/admin to verify the success
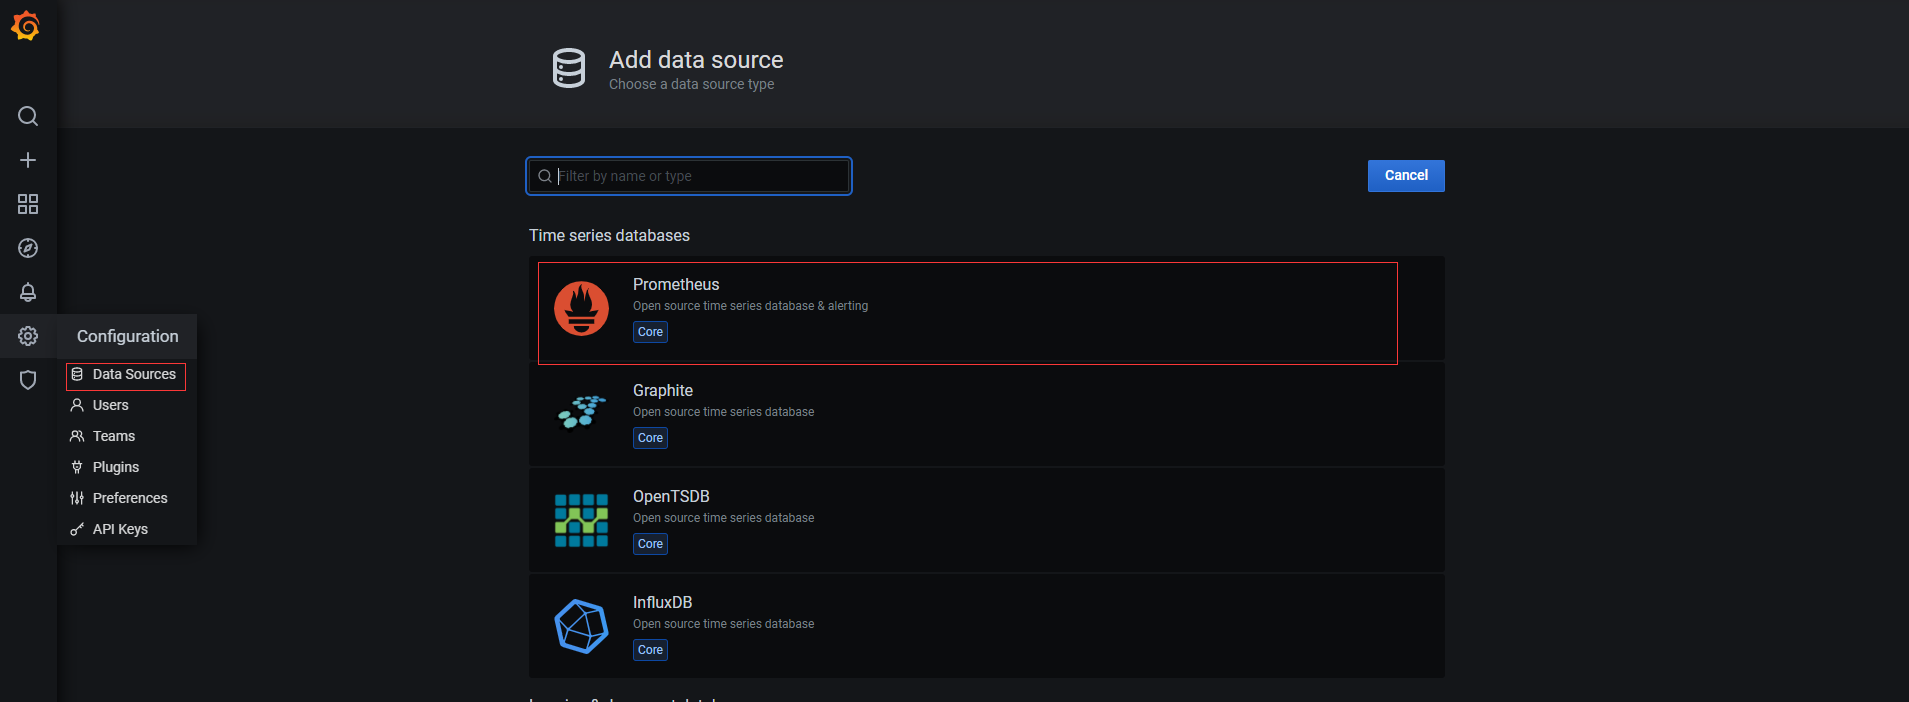
- Config Prometheus DataSource
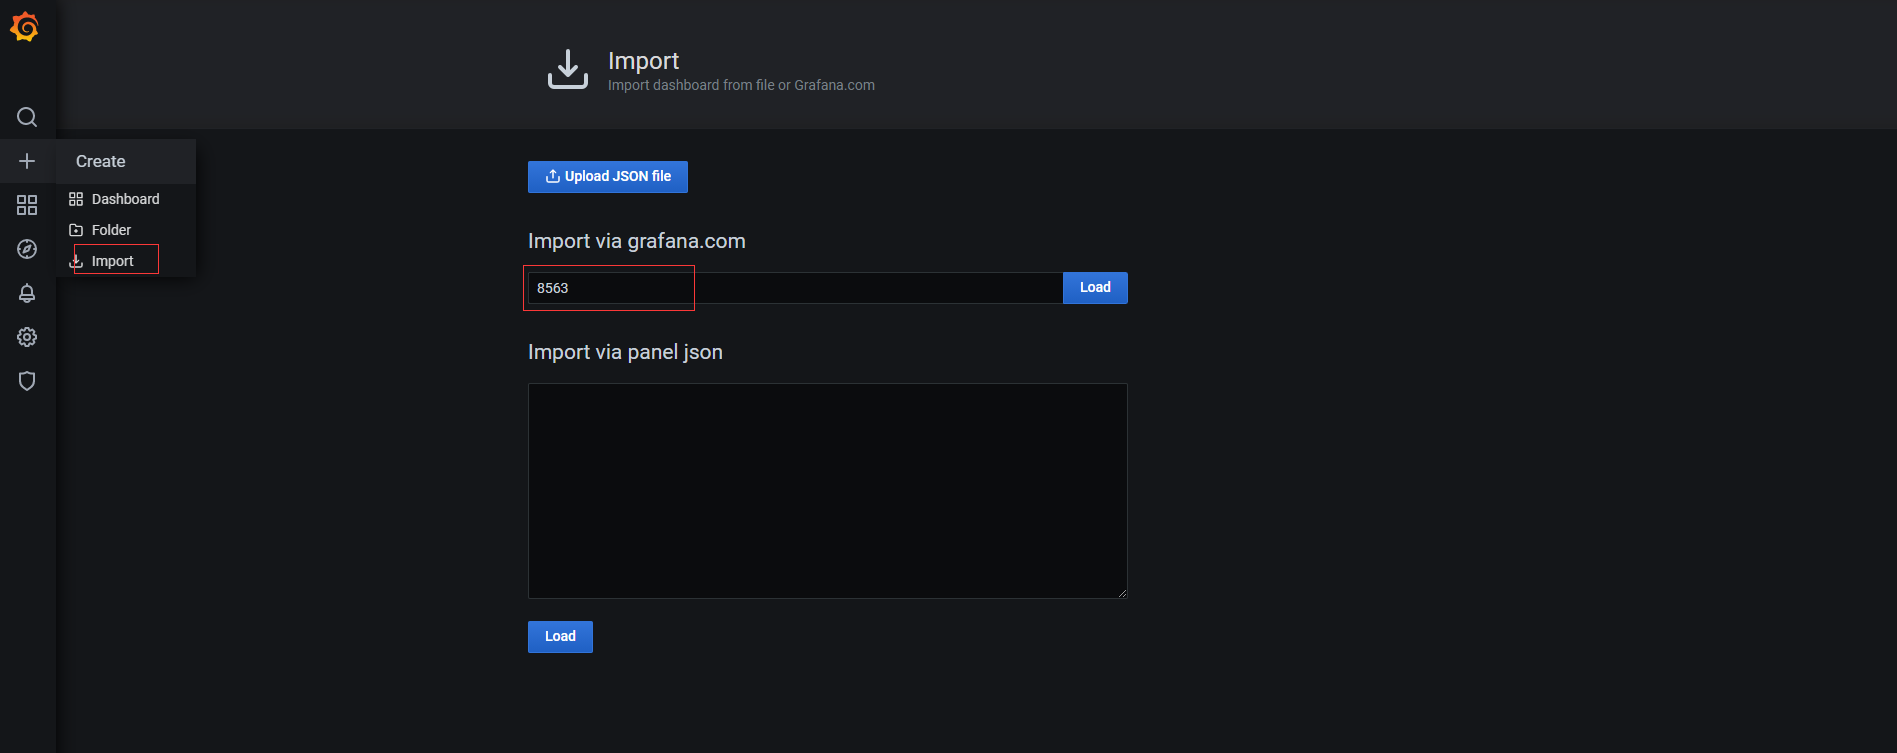
- Config JVM Dashboard
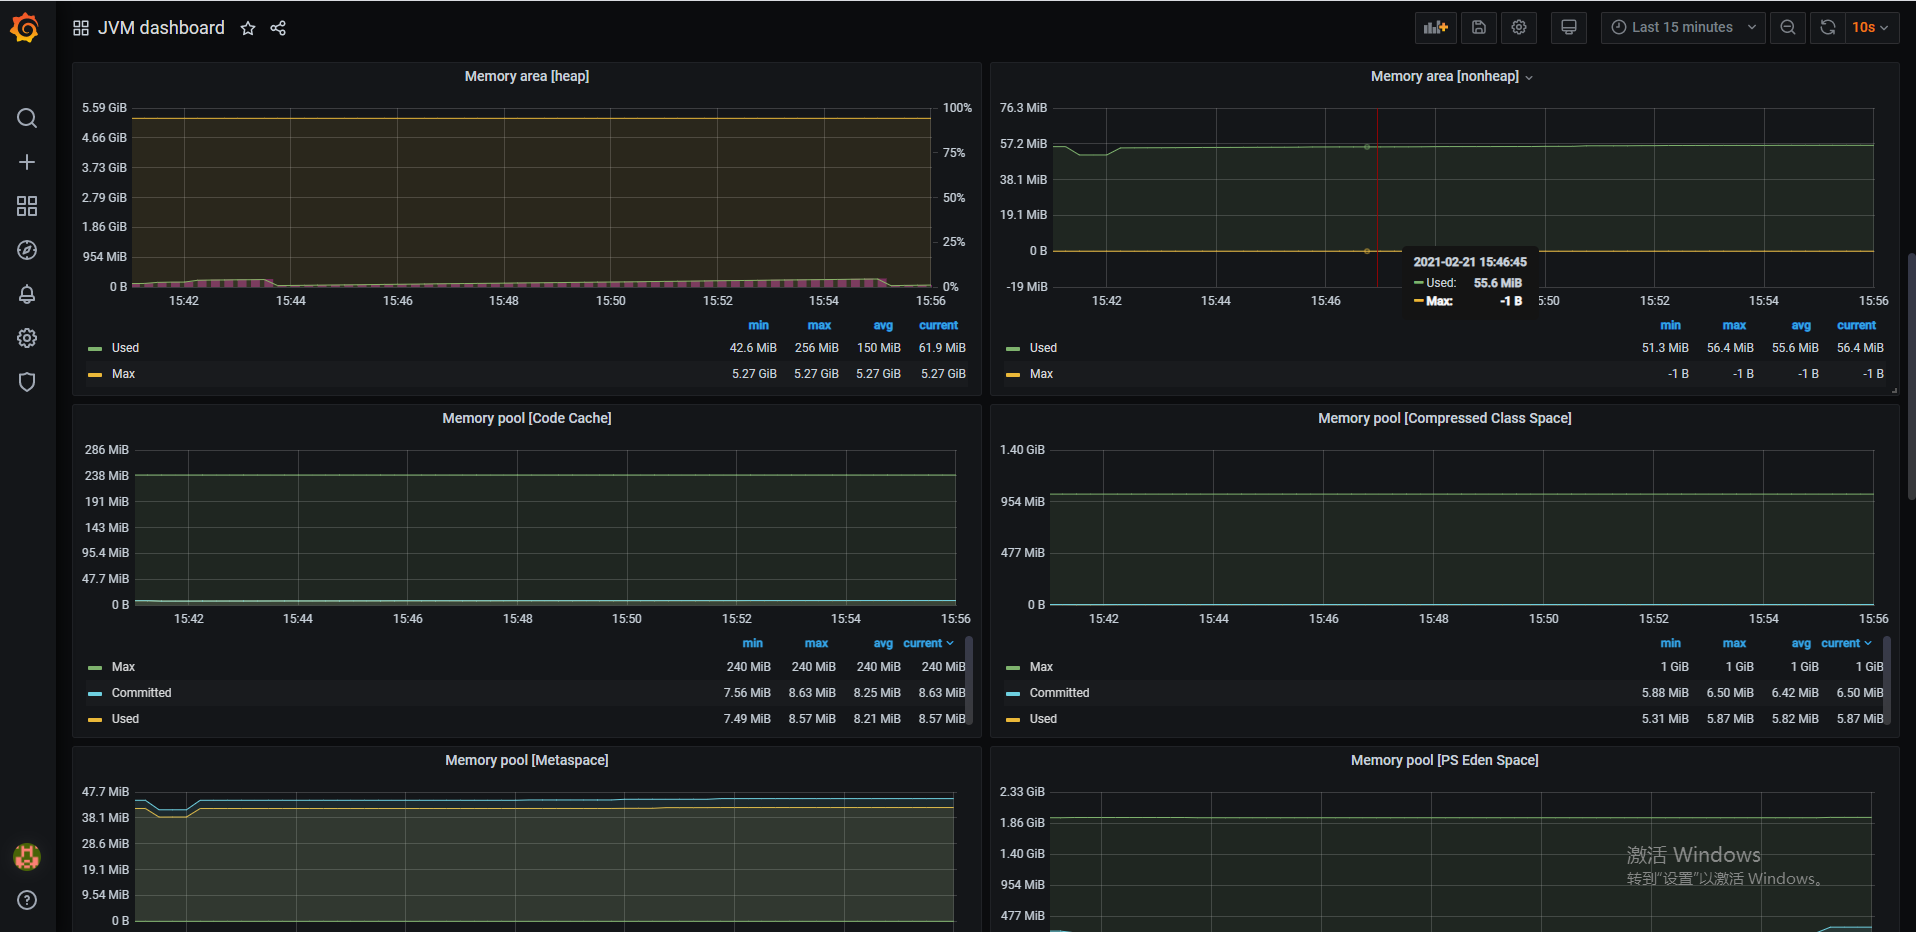
Click Create - Import and enter the dashboards ID (8563 recommended).
The final JVM monitor panel looks like this:
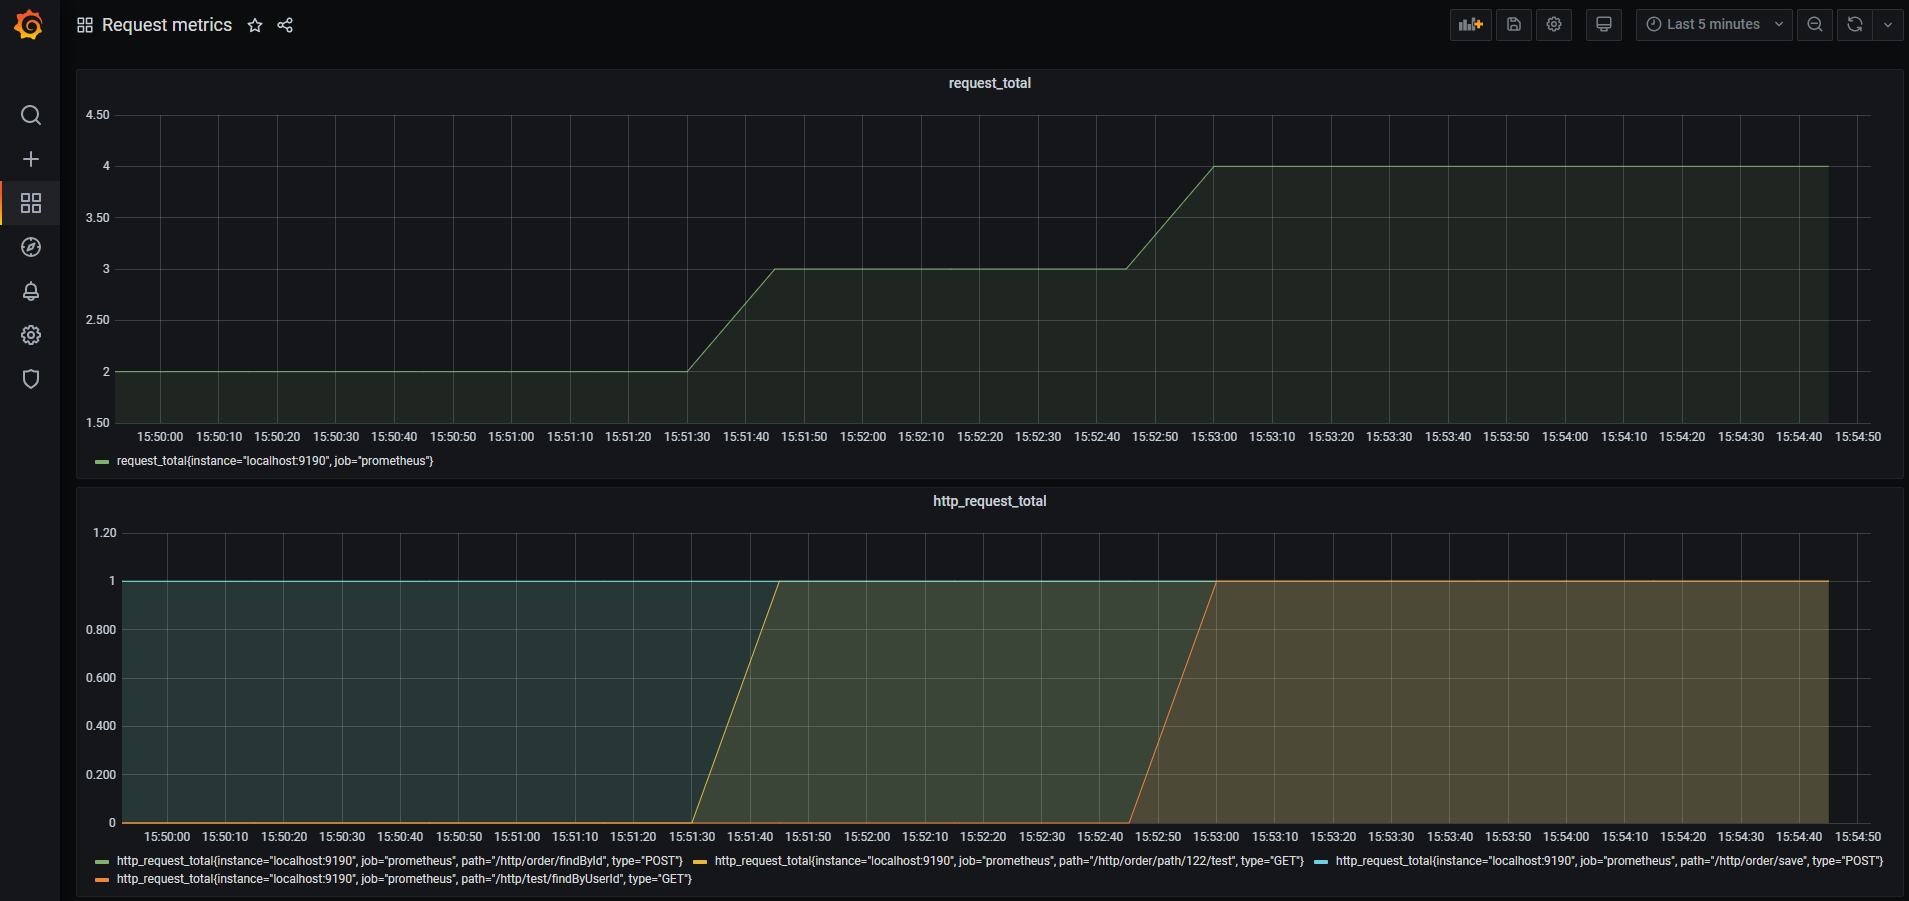
- Config Custom Metric Dashboard
request_total、http_request_total
Click Create - Import and enter the panel config json
The final custom HTTP request monitoring panel looks like this: