Logging-RocketMQ Plugin
Description
Apache ShenYuThe gateway receives requests from the client, forwards them to the server, and returns the server results to the client. The gateway can record the details of each request,
The list includes: request time, request parameters, request path, response result, response status code, time consumption, upstream IP, exception information waiting.
The Logging-RocketMQ plugin is a plugin that records access logs and sends them to the RocketMQ cluster.
Technical Solutions
-
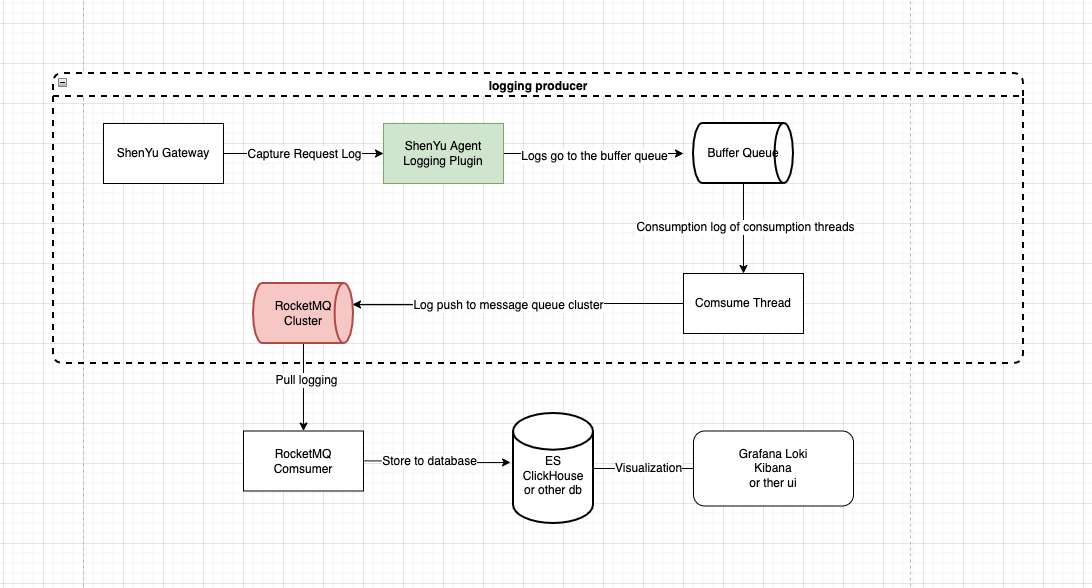
Architecture Diagram
-
Full asynchronous collection and delivery of
Logginginside theApache ShenYugateway -
Logging platform by consuming the logs in the
RocketMQcluster for repository, and then usingGrafana,Kibanaor other visualization platform to display
Plugin Usage
1.Add the Logging-RocketMQ dependency to the gateway's pom.xml file.
        <!--shenyu logging-rocketmq plugin start-->
        <dependency>
          <groupId>org.apache.shenyu</groupId>
          <artifactId>shenyu-spring-boot-starter-plugin-logging-rocketmq</artifactId>
          <version>${project.version}</version>
        </dependency>
        <!--shenyu logging-rocketmq plugin end-->
2.In shenyu-admin --> Basic Configuration --> Plugin Management --> loggingRocketMQ, configure the rocketMQ parameter and set it to on.
2.1Open the plugin and configure rocketmq, configure it as follows.
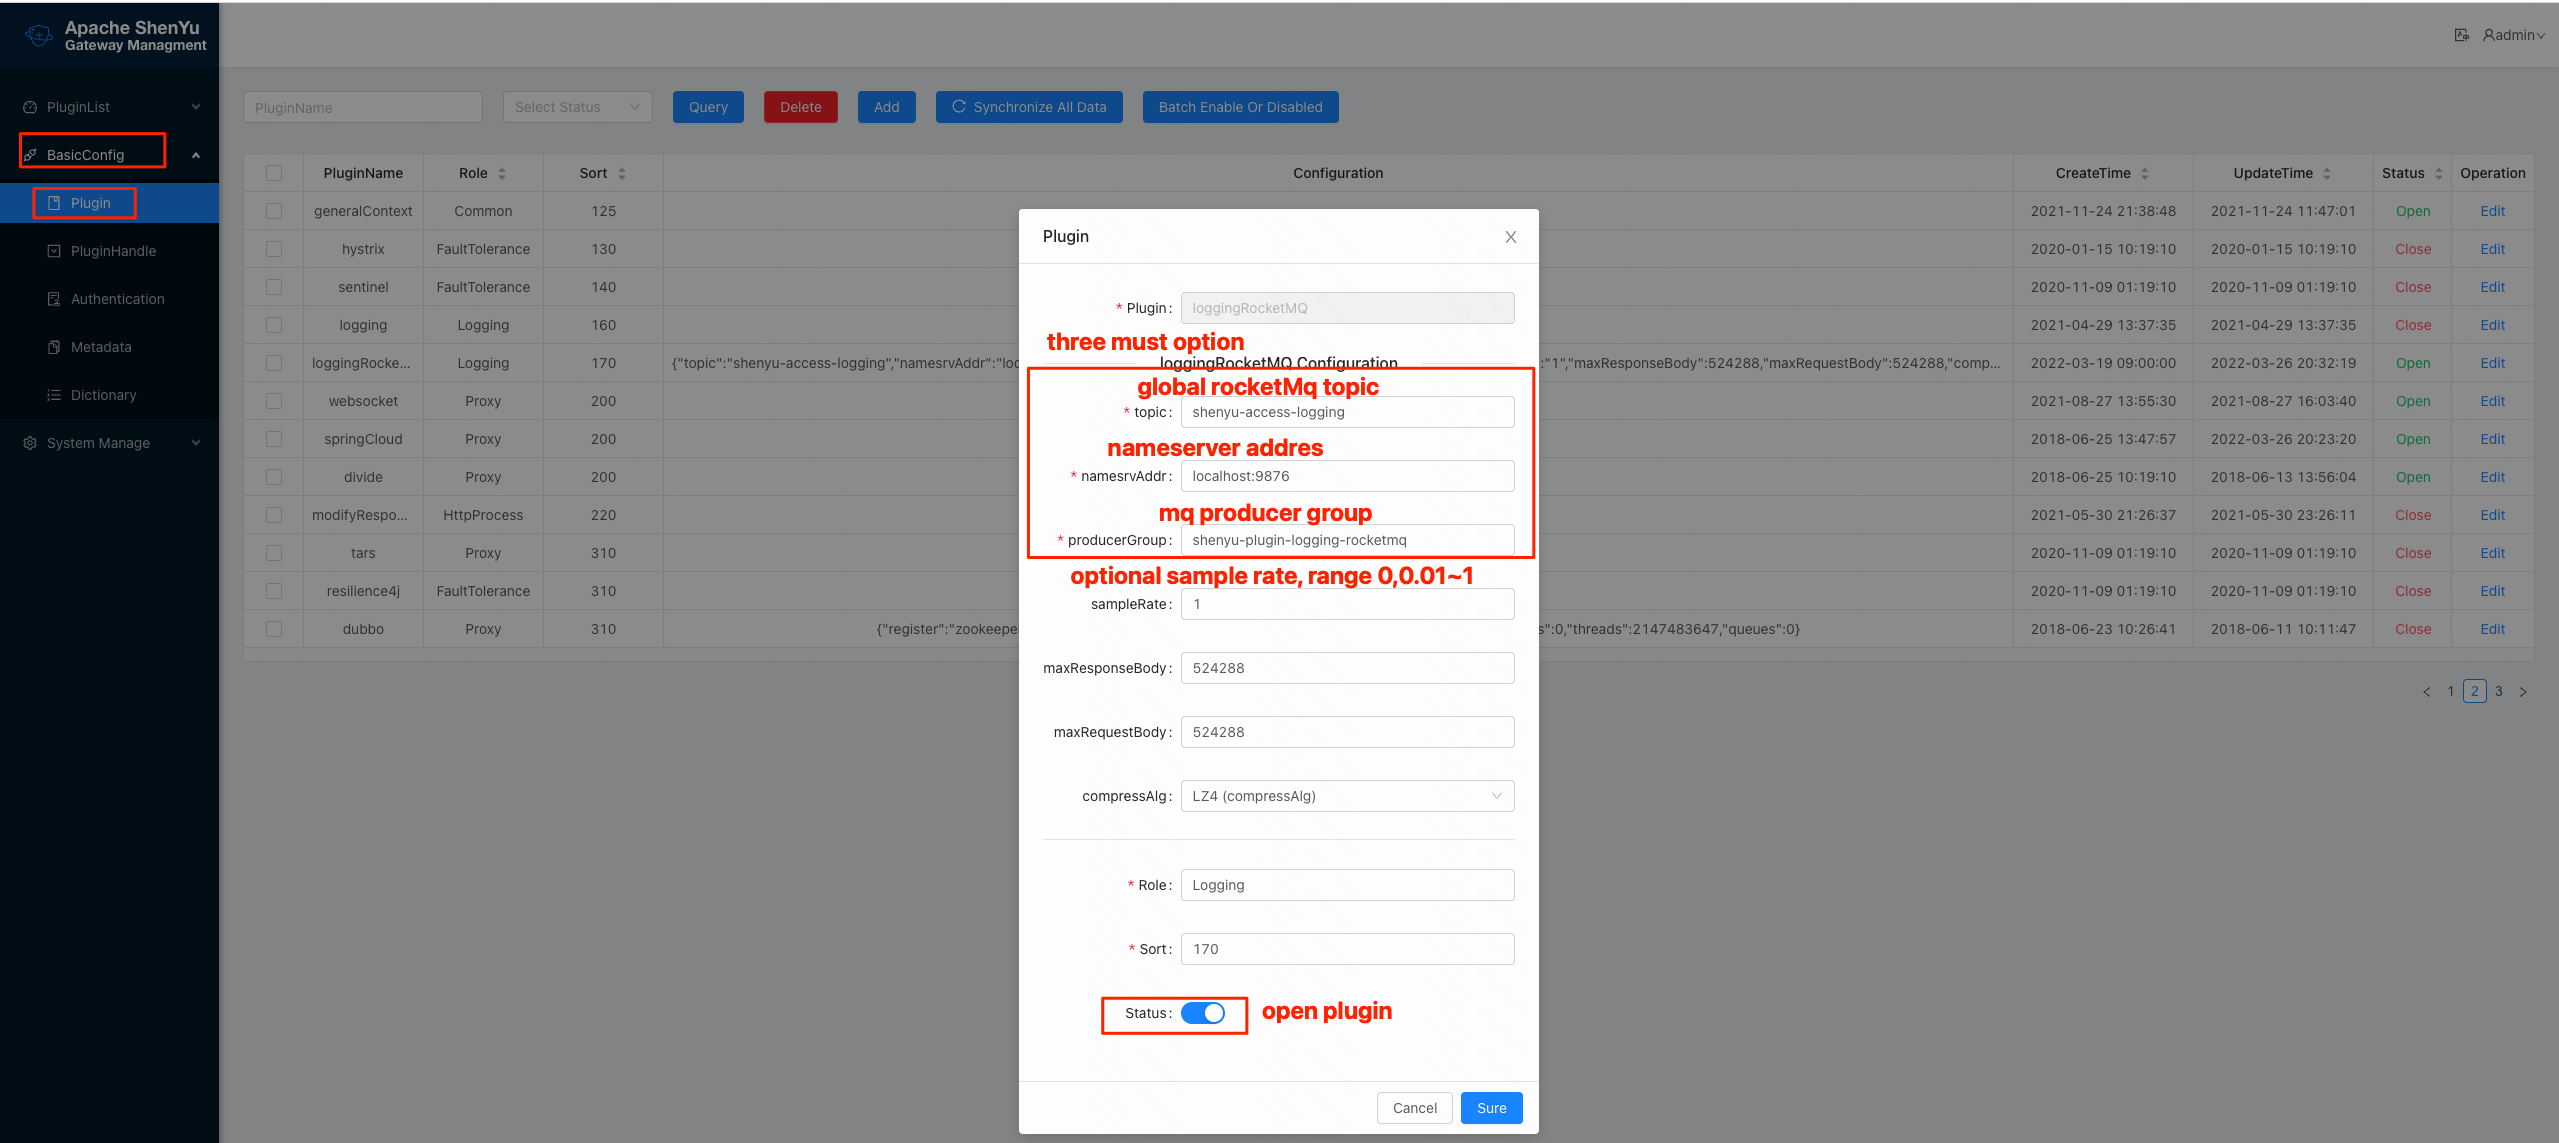
- The individual configuration items are described as follows:
| config-item | type | description | remarks |
| topic | String | Message Queue Topics | must |
| namesrvAddr | String | Message queue nameserver address | must |
| producerGroup | String | Log Message Producer Group | must |
| sampleRate | String | Sampling rate, range 0~1, 0: off, 0.01: acquisition 1%, 1: acquisition 100% | Optional, default 1, all collection |
| compressAlg | String | Compression algorithm, no compression by default, currently supports LZ4 compression | Optional, no compression by default |
| maxResponseBody | Ingeter | Maximum response size, above the threshold no response will be collected | Optional, default 512KB |
| maxRequestBody | Ingeter | Maximum request body size, above the threshold no request body will be collected | Optional, default 512KB |
| Except for topic, namesrvAddr, producerGroup, all others are optional, in most cases only these 3 items need to be configured. |
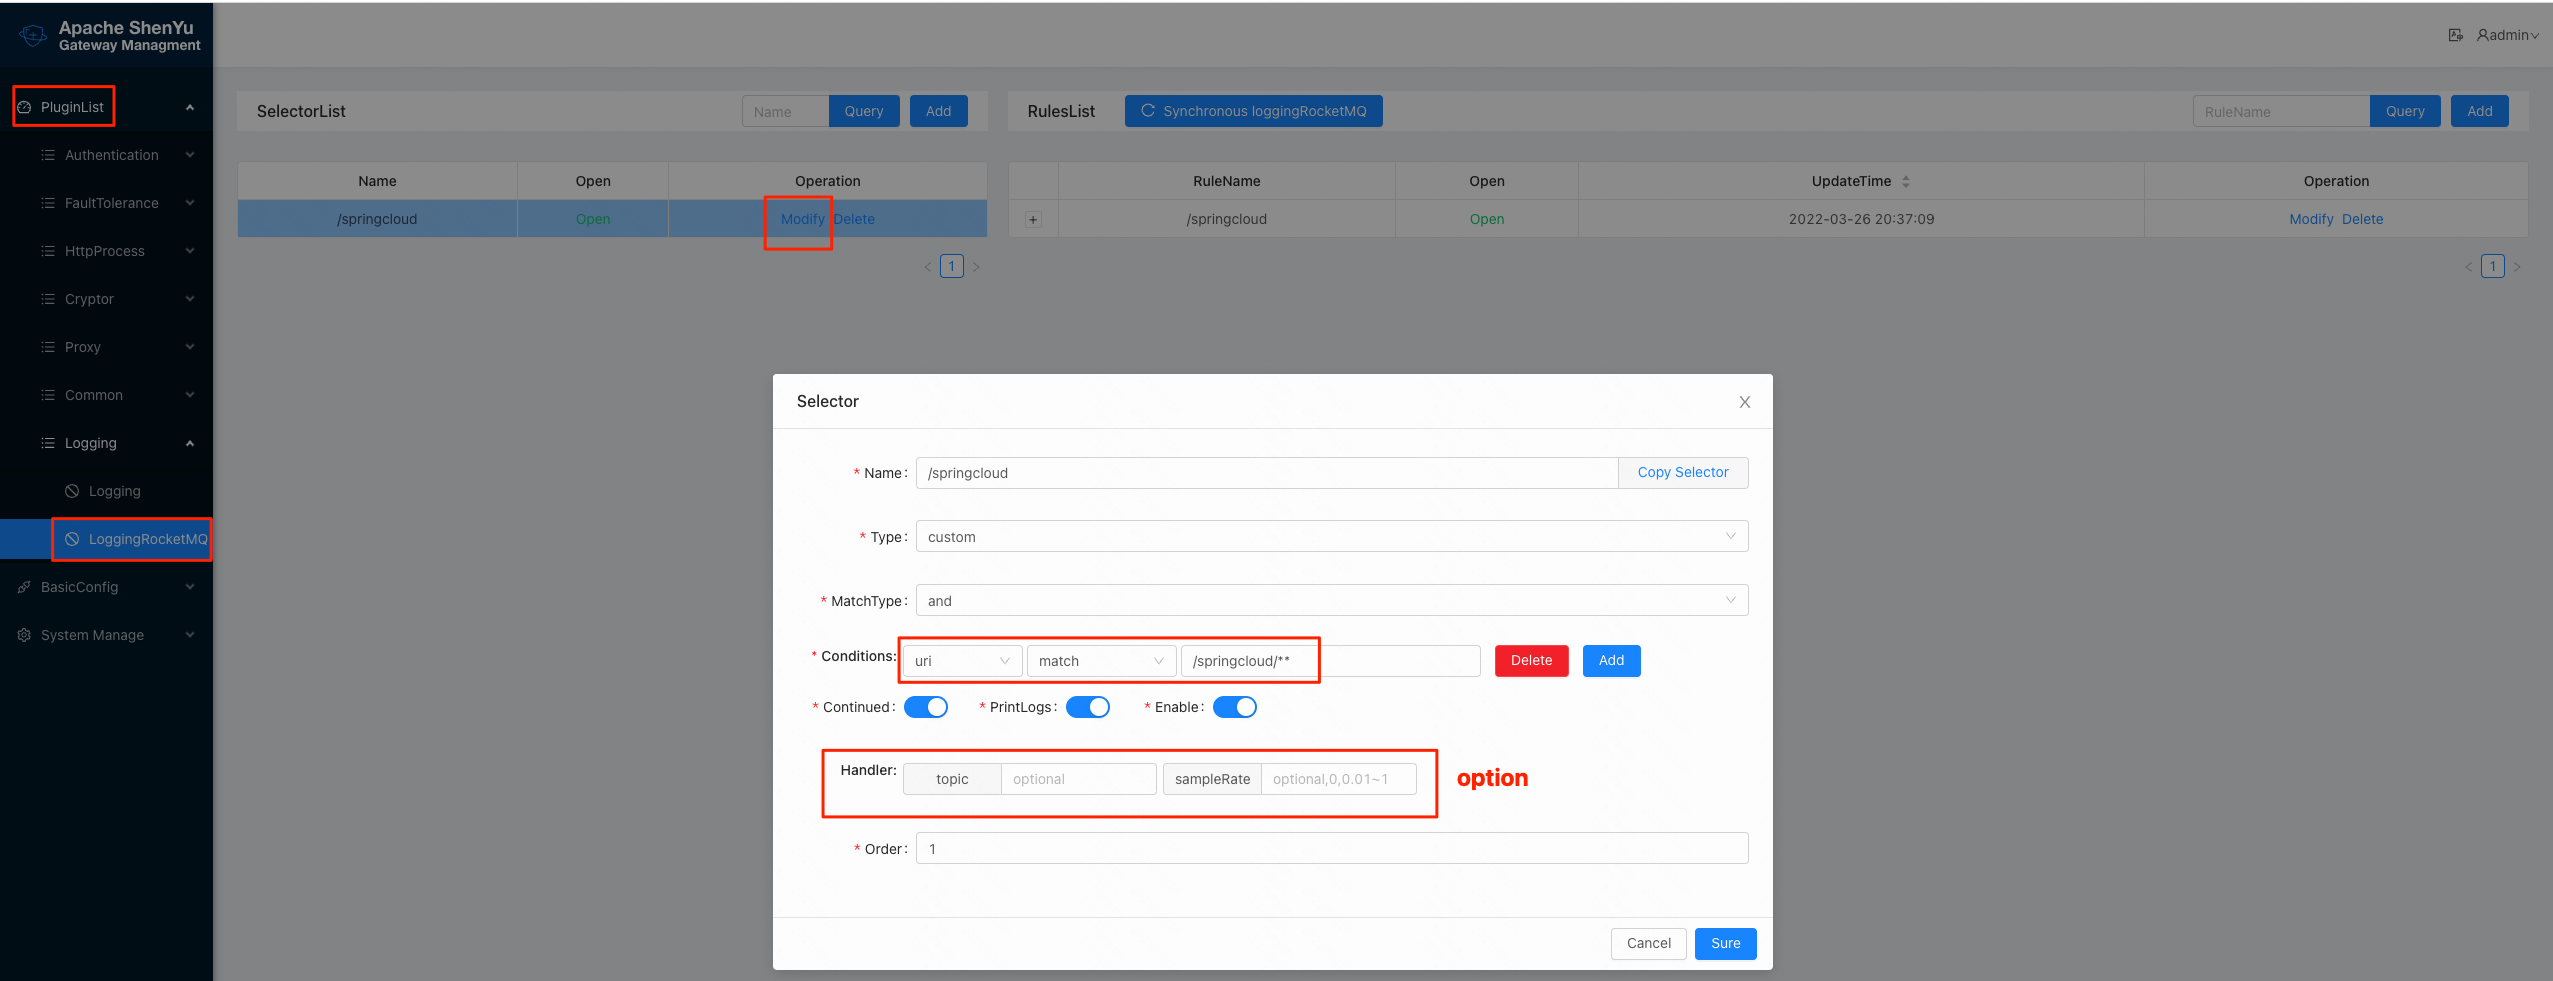
2.2 Configuring Selectors and Rulers
For detailed configuration of selectors and rules, please refer to: Selector and rule management。
In addition sometimes a large gateway cluster corresponds to multiple applications (business), different applications (business) corresponds to different topics, related to isolation,
then you can configure different topics (optional) and sampling rate (optional) by selector, the meaning of the configuration items as shown in the table above.
The operation is shown below:
Logging information
The fields of the captured access log are as follows.
| Field Name | Meaning | Description | Remarks |
|---|---|---|---|
| clientIp | Client IP | ||
| timeLocal | Request time string, format: yyyy-MM-dd HH:mm:ss.SSS | ||
| method | request method (different rpc type is not the same, http class for: get, post wait, rpc class for the interface name) | ||
| requestHeader | Request header (json format) | ||
| responseHeader | Response header (json format) | ||
| queryParams | Request query parameters | ||
| requestBody | Request Body (body of binary type will not be captured) | ||
| requestUri | Request uri | ||
| responseBody | Response body | ||
| responseContentLength | Response body size | ||
| rpcType | rpc type | ||
| status | response status | ||
| upstreamIp | Upstream (program providing the service) IP | ||
| upstreamResponseTime | Time taken by the upstream (program providing the service) to respond to the request (ms ms) | ||
| userAgent | Requested user agent | ||
| host | The requested host | ||
| module | Requested modules | ||
| path | The requested path | ||
| traceId | Requested Link Tracking ID | Need to access link tracking plugins, such as skywalking,zipkin |
Consumption and display of Logging
As each logging platform has differences, such as storage available clickhouse, ElasticSearch, etc., visualization has self-developed or open source Grafana, Kibana, etc..
Logging-RocketMQ plugin uses RocketMQ to decouple production and consumption, while outputting logs in json format,
consumption and visualization require users to choose different technology stacks to achieve their own situation.
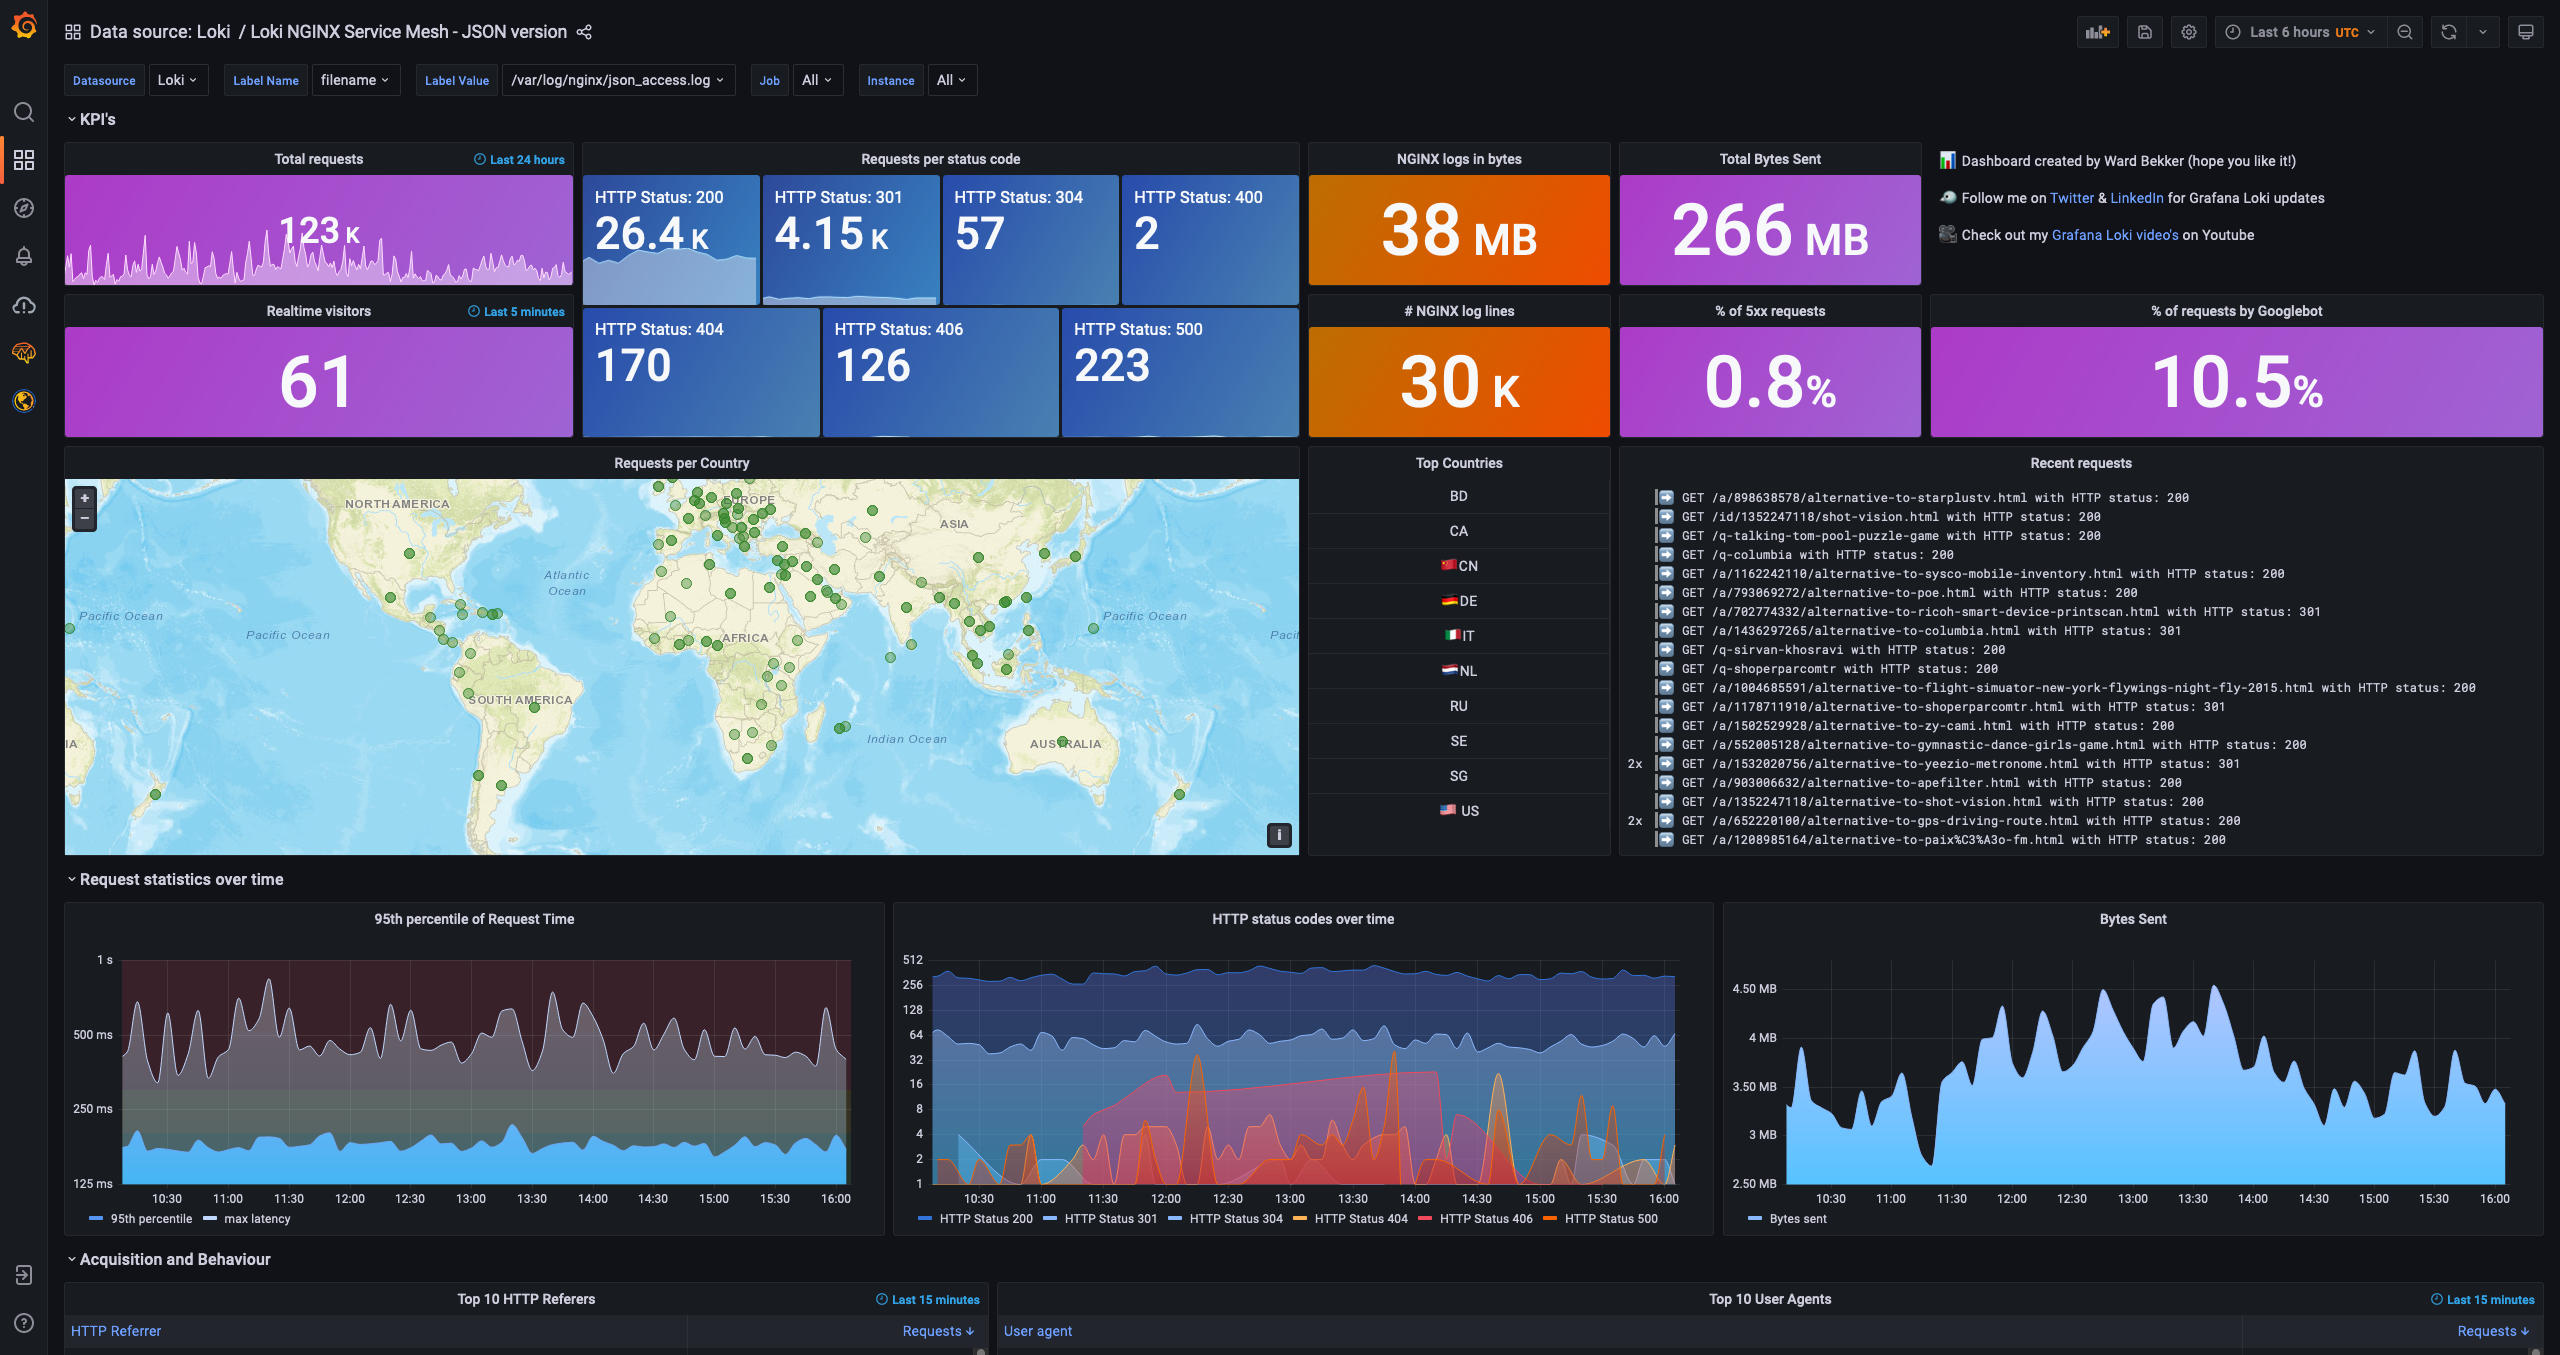
Panel Display
Users can choose to visualize the implementation according to their own situation.
The following shows the effect of Grafana:
Grafana Sandbox Experience